Peruvian vs Serbian 2nd Grade
COMPARE
Peruvian
Serbian
2nd Grade
2nd Grade Comparison
Peruvians
Serbians
97.5%
2ND GRADE
0.9/ 100
METRIC RATING
250th/ 347
METRIC RANK
98.3%
2ND GRADE
99.6/ 100
METRIC RATING
70th/ 347
METRIC RANK
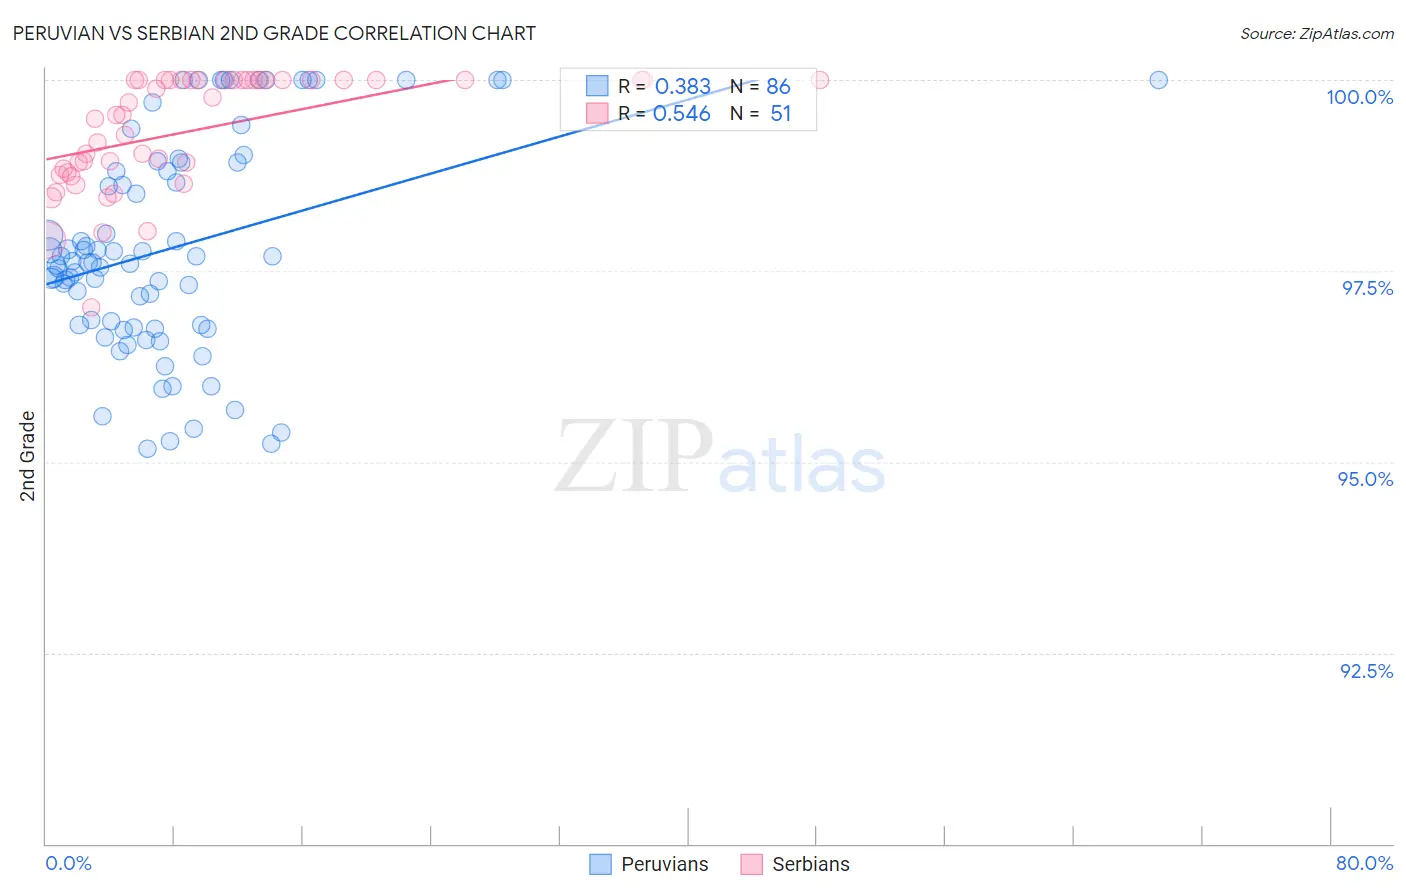
Peruvian vs Serbian 2nd Grade Correlation Chart
The statistical analysis conducted on geographies consisting of 363,068,462 people shows a mild positive correlation between the proportion of Peruvians and percentage of population with at least 2nd grade education in the United States with a correlation coefficient (R) of 0.383 and weighted average of 97.5%. Similarly, the statistical analysis conducted on geographies consisting of 267,642,942 people shows a substantial positive correlation between the proportion of Serbians and percentage of population with at least 2nd grade education in the United States with a correlation coefficient (R) of 0.546 and weighted average of 98.3%, a difference of 0.82%.
2nd Grade Correlation Summary
| Measurement | Peruvian | Serbian |
| Minimum | 95.2% | 97.0% |
| Maximum | 100.0% | 100.0% |
| Range | 4.8% | 3.0% |
| Mean | 97.8% | 99.3% |
| Median | 97.6% | 99.5% |
| Interquartile 25% (IQ1) | 96.8% | 98.8% |
| Interquartile 75% (IQ3) | 98.9% | 100.0% |
| Interquartile Range (IQR) | 2.1% | 1.2% |
| Standard Deviation (Sample) | 1.4% | 0.74% |
| Standard Deviation (Population) | 1.4% | 0.73% |
Similar Demographics by 2nd Grade
Demographics Similar to Peruvians by 2nd Grade
In terms of 2nd grade, the demographic groups most similar to Peruvians are Bolivian (97.5%, a difference of 0.0%), Immigrants from Iraq (97.5%, a difference of 0.010%), Immigrants from Eastern Africa (97.5%, a difference of 0.010%), South American (97.5%, a difference of 0.010%), and Immigrants from Senegal (97.5%, a difference of 0.010%).
| Demographics | Rating | Rank | 2nd Grade |
| Asians | 1.1 /100 | #243 | Tragic 97.5% |
| Immigrants | Iraq | 1.0 /100 | #244 | Tragic 97.5% |
| Immigrants | Eastern Africa | 0.9 /100 | #245 | Tragic 97.5% |
| South Americans | 0.9 /100 | #246 | Tragic 97.5% |
| Immigrants | Senegal | 0.9 /100 | #247 | Tragic 97.5% |
| Immigrants | Middle Africa | 0.9 /100 | #248 | Tragic 97.5% |
| Bolivians | 0.9 /100 | #249 | Tragic 97.5% |
| Peruvians | 0.9 /100 | #250 | Tragic 97.5% |
| Immigrants | Africa | 0.8 /100 | #251 | Tragic 97.5% |
| Immigrants | Asia | 0.7 /100 | #252 | Tragic 97.5% |
| Puerto Ricans | 0.7 /100 | #253 | Tragic 97.5% |
| Indians (Asian) | 0.6 /100 | #254 | Tragic 97.5% |
| Immigrants | Congo | 0.6 /100 | #255 | Tragic 97.5% |
| Jamaicans | 0.6 /100 | #256 | Tragic 97.5% |
| Immigrants | Colombia | 0.5 /100 | #257 | Tragic 97.5% |
Demographics Similar to Serbians by 2nd Grade
In terms of 2nd grade, the demographic groups most similar to Serbians are Immigrants from Northern Europe (98.3%, a difference of 0.0%), Russian (98.3%, a difference of 0.0%), Immigrants from Austria (98.3%, a difference of 0.0%), Chickasaw (98.3%, a difference of 0.0%), and Canadian (98.3%, a difference of 0.010%).
| Demographics | Rating | Rank | 2nd Grade |
| Maltese | 99.7 /100 | #63 | Exceptional 98.3% |
| Immigrants | North America | 99.7 /100 | #64 | Exceptional 98.3% |
| New Zealanders | 99.7 /100 | #65 | Exceptional 98.3% |
| Canadians | 99.7 /100 | #66 | Exceptional 98.3% |
| Immigrants | Northern Europe | 99.7 /100 | #67 | Exceptional 98.3% |
| Russians | 99.7 /100 | #68 | Exceptional 98.3% |
| Immigrants | Austria | 99.6 /100 | #69 | Exceptional 98.3% |
| Serbians | 99.6 /100 | #70 | Exceptional 98.3% |
| Chickasaw | 99.6 /100 | #71 | Exceptional 98.3% |
| Cheyenne | 99.6 /100 | #72 | Exceptional 98.3% |
| Cajuns | 99.5 /100 | #73 | Exceptional 98.3% |
| Immigrants | Netherlands | 99.4 /100 | #74 | Exceptional 98.3% |
| Shoshone | 99.4 /100 | #75 | Exceptional 98.3% |
| Cherokee | 99.4 /100 | #76 | Exceptional 98.3% |
| Immigrants | England | 99.4 /100 | #77 | Exceptional 98.3% |