Peruvian vs Immigrants from Egypt Median Female Earnings
COMPARE
Peruvian
Immigrants from Egypt
Median Female Earnings
Median Female Earnings Comparison
Peruvians
Immigrants from Egypt
$40,234
MEDIAN FEMALE EARNINGS
75.3/ 100
METRIC RATING
156th/ 347
METRIC RANK
$42,837
MEDIAN FEMALE EARNINGS
99.9/ 100
METRIC RATING
67th/ 347
METRIC RANK
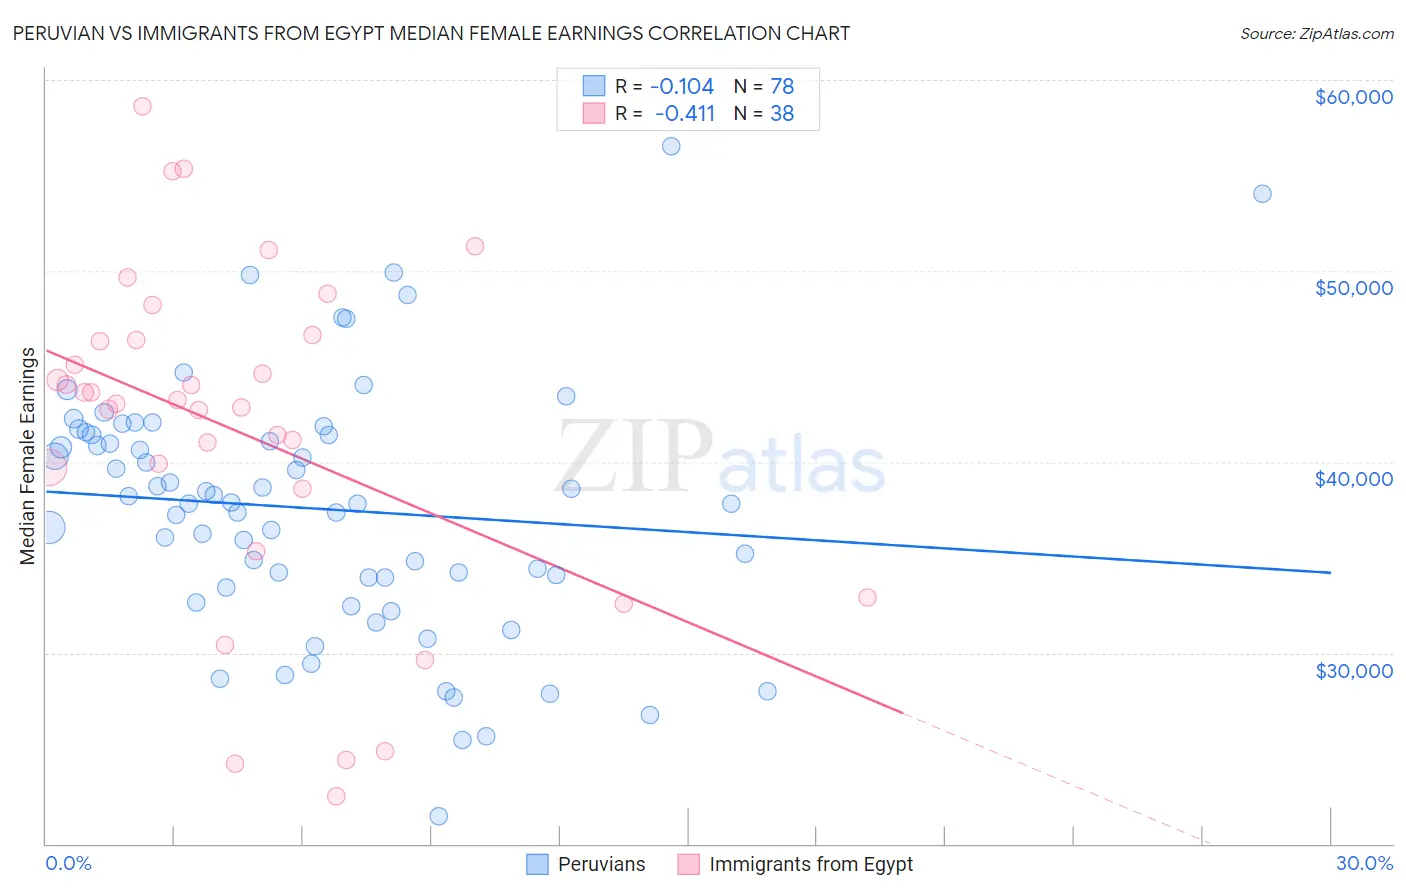
Peruvian vs Immigrants from Egypt Median Female Earnings Correlation Chart
The statistical analysis conducted on geographies consisting of 363,169,099 people shows a poor negative correlation between the proportion of Peruvians and median female earnings in the United States with a correlation coefficient (R) of -0.104 and weighted average of $40,234. Similarly, the statistical analysis conducted on geographies consisting of 245,465,633 people shows a moderate negative correlation between the proportion of Immigrants from Egypt and median female earnings in the United States with a correlation coefficient (R) of -0.411 and weighted average of $42,837, a difference of 6.5%.
Median Female Earnings Correlation Summary
| Measurement | Peruvian | Immigrants from Egypt |
| Minimum | $21,456 | $22,500 |
| Maximum | $56,528 | $58,618 |
| Range | $35,072 | $36,118 |
| Mean | $37,547 | $41,582 |
| Median | $37,836 | $43,155 |
| Interquartile 25% (IQ1) | $33,920 | $38,571 |
| Interquartile 75% (IQ3) | $41,414 | $46,404 |
| Interquartile Range (IQR) | $7,494 | $7,833 |
| Standard Deviation (Sample) | $6,584 | $8,802 |
| Standard Deviation (Population) | $6,542 | $8,685 |
Similar Demographics by Median Female Earnings
Demographics Similar to Peruvians by Median Female Earnings
In terms of median female earnings, the demographic groups most similar to Peruvians are Immigrants from Africa ($40,257, a difference of 0.060%), Portuguese ($40,177, a difference of 0.14%), British West Indian ($40,299, a difference of 0.16%), Immigrants from Oceania ($40,297, a difference of 0.16%), and Immigrants from Senegal ($40,157, a difference of 0.19%).
| Demographics | Rating | Rank | Median Female Earnings |
| Immigrants | Cameroon | 79.7 /100 | #149 | Good $40,354 |
| Immigrants | Chile | 79.6 /100 | #150 | Good $40,353 |
| Immigrants | Armenia | 79.2 /100 | #151 | Good $40,340 |
| West Indians | 78.4 /100 | #152 | Good $40,317 |
| British West Indians | 77.7 /100 | #153 | Good $40,299 |
| Immigrants | Oceania | 77.6 /100 | #154 | Good $40,297 |
| Immigrants | Africa | 76.2 /100 | #155 | Good $40,257 |
| Peruvians | 75.3 /100 | #156 | Good $40,234 |
| Portuguese | 73.0 /100 | #157 | Good $40,177 |
| Immigrants | Senegal | 72.2 /100 | #158 | Good $40,157 |
| Immigrants | Vietnam | 72.0 /100 | #159 | Good $40,153 |
| Inupiat | 68.9 /100 | #160 | Good $40,080 |
| Alsatians | 68.0 /100 | #161 | Good $40,060 |
| South American Indians | 66.1 /100 | #162 | Good $40,019 |
| Lebanese | 65.5 /100 | #163 | Good $40,006 |
Demographics Similar to Immigrants from Egypt by Median Female Earnings
In terms of median female earnings, the demographic groups most similar to Immigrants from Egypt are Immigrants from Norway ($42,837, a difference of 0.0%), Immigrants from Austria ($42,824, a difference of 0.030%), Immigrants from Spain ($42,815, a difference of 0.050%), Sierra Leonean ($42,868, a difference of 0.070%), and Immigrants from Ethiopia ($42,744, a difference of 0.22%).
| Demographics | Rating | Rank | Median Female Earnings |
| Immigrants | Latvia | 99.9 /100 | #60 | Exceptional $43,099 |
| Immigrants | Bulgaria | 99.9 /100 | #61 | Exceptional $43,085 |
| Afghans | 99.9 /100 | #62 | Exceptional $43,077 |
| Immigrants | Ukraine | 99.9 /100 | #63 | Exceptional $43,069 |
| Immigrants | Pakistan | 99.9 /100 | #64 | Exceptional $43,052 |
| Sierra Leoneans | 99.9 /100 | #65 | Exceptional $42,868 |
| Immigrants | Norway | 99.9 /100 | #66 | Exceptional $42,837 |
| Immigrants | Egypt | 99.9 /100 | #67 | Exceptional $42,837 |
| Immigrants | Austria | 99.8 /100 | #68 | Exceptional $42,824 |
| Immigrants | Spain | 99.8 /100 | #69 | Exceptional $42,815 |
| Immigrants | Ethiopia | 99.8 /100 | #70 | Exceptional $42,744 |
| Immigrants | Romania | 99.8 /100 | #71 | Exceptional $42,718 |
| Albanians | 99.8 /100 | #72 | Exceptional $42,584 |
| Mongolians | 99.7 /100 | #73 | Exceptional $42,542 |
| Immigrants | South Africa | 99.7 /100 | #74 | Exceptional $42,508 |