Fijian vs Immigrants from Korea Householder Income Under 25 years
COMPARE
Fijian
Immigrants from Korea
Householder Income Under 25 years
Householder Income Under 25 years Comparison
Fijians
Immigrants from Korea
$50,132
HOUSEHOLDER INCOME UNDER 25 YEARS
0.6/ 100
METRIC RATING
264th/ 347
METRIC RANK
$55,716
HOUSEHOLDER INCOME UNDER 25 YEARS
100.0/ 100
METRIC RATING
42nd/ 347
METRIC RANK
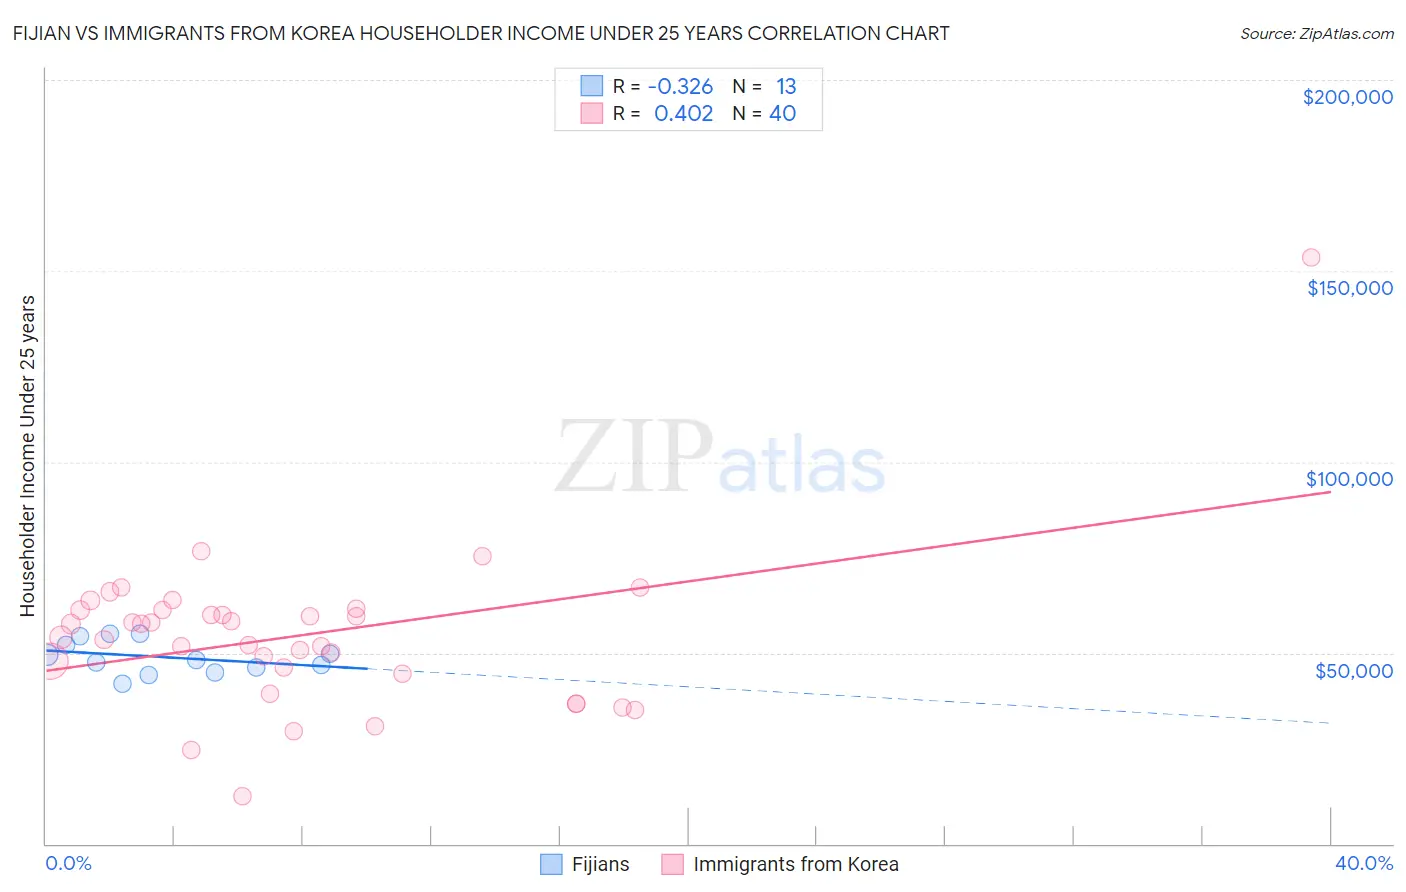
Fijian vs Immigrants from Korea Householder Income Under 25 years Correlation Chart
The statistical analysis conducted on geographies consisting of 53,807,935 people shows a mild negative correlation between the proportion of Fijians and household income with householder under the age of 25 in the United States with a correlation coefficient (R) of -0.326 and weighted average of $50,132. Similarly, the statistical analysis conducted on geographies consisting of 348,325,836 people shows a moderate positive correlation between the proportion of Immigrants from Korea and household income with householder under the age of 25 in the United States with a correlation coefficient (R) of 0.402 and weighted average of $55,716, a difference of 11.1%.
Householder Income Under 25 years Correlation Summary
| Measurement | Fijian | Immigrants from Korea |
| Minimum | $42,002 | $12,383 |
| Maximum | $55,154 | $153,485 |
| Range | $13,151 | $141,102 |
| Mean | $48,862 | $54,433 |
| Median | $48,154 | $55,776 |
| Interquartile 25% (IQ1) | $45,561 | $45,346 |
| Interquartile 75% (IQ3) | $53,230 | $61,192 |
| Interquartile Range (IQR) | $7,669 | $15,846 |
| Standard Deviation (Sample) | $4,254 | $21,118 |
| Standard Deviation (Population) | $4,087 | $20,853 |
Similar Demographics by Householder Income Under 25 years
Demographics Similar to Fijians by Householder Income Under 25 years
In terms of householder income under 25 years, the demographic groups most similar to Fijians are Belgian ($50,113, a difference of 0.040%), Immigrants from Venezuela ($50,109, a difference of 0.050%), Immigrants from Dominican Republic ($50,204, a difference of 0.14%), Immigrants from Laos ($50,041, a difference of 0.18%), and Haitian ($50,231, a difference of 0.20%).
| Demographics | Rating | Rank | Householder Income Under 25 years |
| Lebanese | 1.1 /100 | #257 | Tragic $50,355 |
| Whites/Caucasians | 1.1 /100 | #258 | Tragic $50,336 |
| Immigrants | Dominica | 1.0 /100 | #259 | Tragic $50,301 |
| Hispanics or Latinos | 0.9 /100 | #260 | Tragic $50,279 |
| Hungarians | 0.9 /100 | #261 | Tragic $50,247 |
| Haitians | 0.8 /100 | #262 | Tragic $50,231 |
| Immigrants | Dominican Republic | 0.8 /100 | #263 | Tragic $50,204 |
| Fijians | 0.6 /100 | #264 | Tragic $50,132 |
| Belgians | 0.6 /100 | #265 | Tragic $50,113 |
| Immigrants | Venezuela | 0.6 /100 | #266 | Tragic $50,109 |
| Immigrants | Laos | 0.5 /100 | #267 | Tragic $50,041 |
| Venezuelans | 0.5 /100 | #268 | Tragic $50,011 |
| Ute | 0.5 /100 | #269 | Tragic $49,997 |
| Mexicans | 0.5 /100 | #270 | Tragic $49,989 |
| Taiwanese | 0.3 /100 | #271 | Tragic $49,804 |
Demographics Similar to Immigrants from Korea by Householder Income Under 25 years
In terms of householder income under 25 years, the demographic groups most similar to Immigrants from Korea are Immigrants from South Eastern Asia ($55,714, a difference of 0.0%), Immigrants from Greece ($55,727, a difference of 0.020%), Immigrants from Guyana ($55,726, a difference of 0.020%), Immigrants from Belarus ($55,743, a difference of 0.050%), and Paraguayan ($55,614, a difference of 0.18%).
| Demographics | Rating | Rank | Householder Income Under 25 years |
| Tlingit-Haida | 100.0 /100 | #35 | Exceptional $55,914 |
| Immigrants | Israel | 100.0 /100 | #36 | Exceptional $55,913 |
| Immigrants | Russia | 100.0 /100 | #37 | Exceptional $55,891 |
| Immigrants | Iran | 100.0 /100 | #38 | Exceptional $55,880 |
| Immigrants | Belarus | 100.0 /100 | #39 | Exceptional $55,743 |
| Immigrants | Greece | 100.0 /100 | #40 | Exceptional $55,727 |
| Immigrants | Guyana | 100.0 /100 | #41 | Exceptional $55,726 |
| Immigrants | Korea | 100.0 /100 | #42 | Exceptional $55,716 |
| Immigrants | South Eastern Asia | 100.0 /100 | #43 | Exceptional $55,714 |
| Paraguayans | 100.0 /100 | #44 | Exceptional $55,614 |
| Spanish American Indians | 100.0 /100 | #45 | Exceptional $55,573 |
| Immigrants | Eastern Europe | 100.0 /100 | #46 | Exceptional $55,572 |
| Cambodians | 100.0 /100 | #47 | Exceptional $55,571 |
| Immigrants | Vietnam | 100.0 /100 | #48 | Exceptional $55,562 |
| Iranians | 100.0 /100 | #49 | Exceptional $55,548 |