Bulgarian vs Bhutanese Householder Income Under 25 years
COMPARE
Bulgarian
Bhutanese
Householder Income Under 25 years
Householder Income Under 25 years Comparison
Bulgarians
Bhutanese
$54,352
HOUSEHOLDER INCOME UNDER 25 YEARS
99.5/ 100
METRIC RATING
84th/ 347
METRIC RANK
$57,078
HOUSEHOLDER INCOME UNDER 25 YEARS
100.0/ 100
METRIC RATING
19th/ 347
METRIC RANK
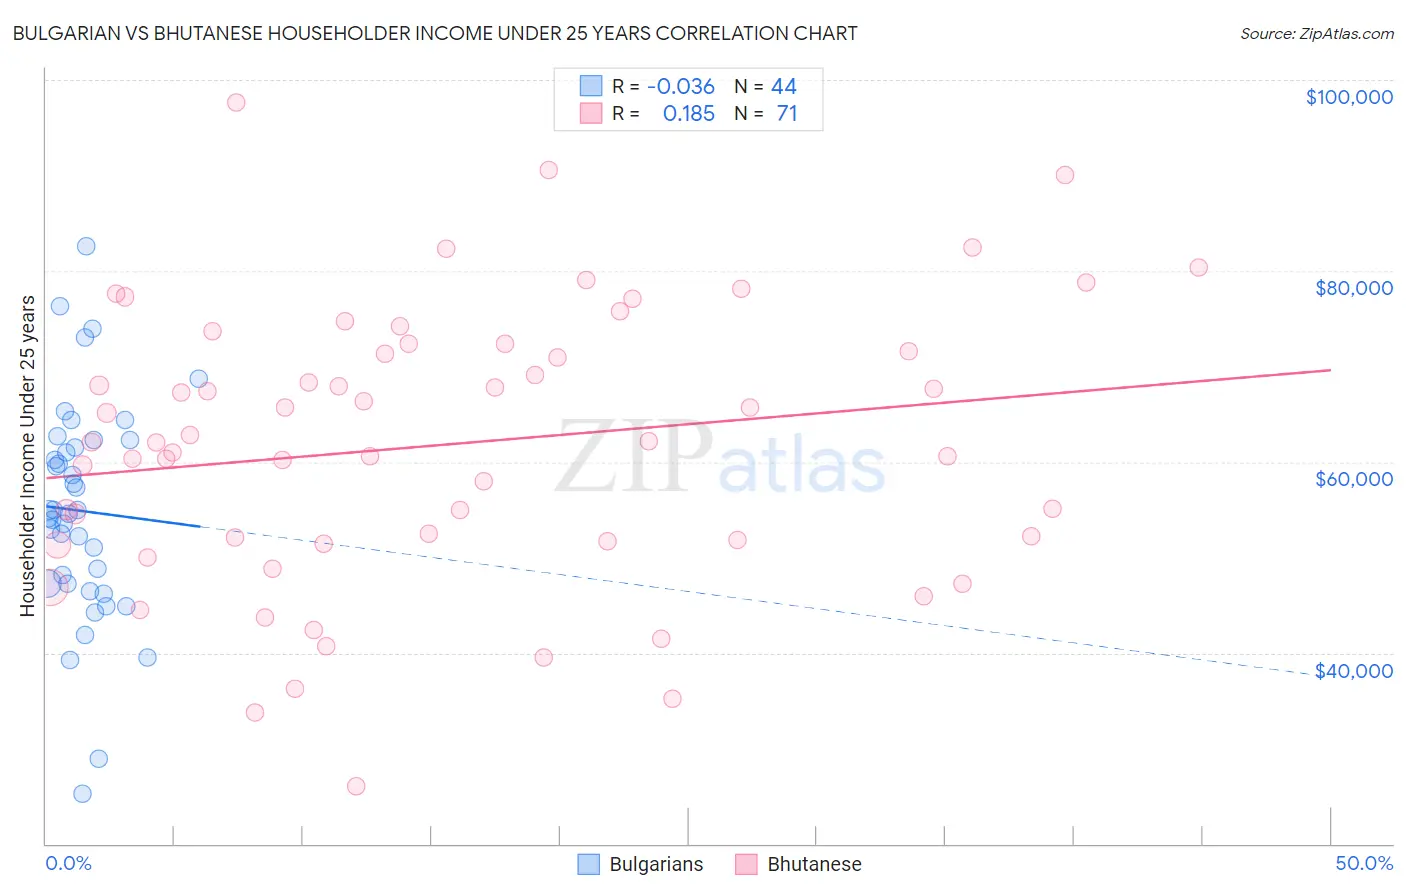
Bulgarian vs Bhutanese Householder Income Under 25 years Correlation Chart
The statistical analysis conducted on geographies consisting of 184,447,475 people shows no correlation between the proportion of Bulgarians and household income with householder under the age of 25 in the United States with a correlation coefficient (R) of -0.036 and weighted average of $54,352. Similarly, the statistical analysis conducted on geographies consisting of 378,977,160 people shows a poor positive correlation between the proportion of Bhutanese and household income with householder under the age of 25 in the United States with a correlation coefficient (R) of 0.185 and weighted average of $57,078, a difference of 5.0%.
Householder Income Under 25 years Correlation Summary
| Measurement | Bulgarian | Bhutanese |
| Minimum | $25,208 | $26,023 |
| Maximum | $82,576 | $97,652 |
| Range | $57,368 | $71,629 |
| Mean | $54,870 | $61,820 |
| Median | $54,743 | $62,088 |
| Interquartile 25% (IQ1) | $47,263 | $51,736 |
| Interquartile 75% (IQ3) | $61,883 | $72,371 |
| Interquartile Range (IQR) | $14,621 | $20,635 |
| Standard Deviation (Sample) | $11,464 | $14,588 |
| Standard Deviation (Population) | $11,333 | $14,485 |
Similar Demographics by Householder Income Under 25 years
Demographics Similar to Bulgarians by Householder Income Under 25 years
In terms of householder income under 25 years, the demographic groups most similar to Bulgarians are Immigrants from Czechoslovakia ($54,352, a difference of 0.0%), Immigrants from Croatia ($54,343, a difference of 0.020%), Laotian ($54,369, a difference of 0.030%), Brazilian ($54,335, a difference of 0.030%), and Yakama ($54,321, a difference of 0.060%).
| Demographics | Rating | Rank | Householder Income Under 25 years |
| Immigrants | Southern Europe | 99.6 /100 | #77 | Exceptional $54,484 |
| Nepalese | 99.6 /100 | #78 | Exceptional $54,472 |
| Immigrants | Italy | 99.6 /100 | #79 | Exceptional $54,449 |
| Egyptians | 99.6 /100 | #80 | Exceptional $54,444 |
| Portuguese | 99.6 /100 | #81 | Exceptional $54,436 |
| Russians | 99.5 /100 | #82 | Exceptional $54,389 |
| Laotians | 99.5 /100 | #83 | Exceptional $54,369 |
| Bulgarians | 99.5 /100 | #84 | Exceptional $54,352 |
| Immigrants | Czechoslovakia | 99.5 /100 | #85 | Exceptional $54,352 |
| Immigrants | Croatia | 99.5 /100 | #86 | Exceptional $54,343 |
| Brazilians | 99.5 /100 | #87 | Exceptional $54,335 |
| Yakama | 99.5 /100 | #88 | Exceptional $54,321 |
| Immigrants | South America | 99.4 /100 | #89 | Exceptional $54,268 |
| Turks | 99.4 /100 | #90 | Exceptional $54,266 |
| Immigrants | Egypt | 99.3 /100 | #91 | Exceptional $54,239 |
Demographics Similar to Bhutanese by Householder Income Under 25 years
In terms of householder income under 25 years, the demographic groups most similar to Bhutanese are Immigrants from Ireland ($57,075, a difference of 0.010%), Immigrants from Fiji ($57,074, a difference of 0.010%), Immigrants from Eastern Asia ($57,123, a difference of 0.080%), Asian ($57,003, a difference of 0.13%), and Tongan ($56,972, a difference of 0.18%).
| Demographics | Rating | Rank | Householder Income Under 25 years |
| Immigrants | Philippines | 100.0 /100 | #12 | Exceptional $57,930 |
| Immigrants | South Central Asia | 100.0 /100 | #13 | Exceptional $57,818 |
| Filipinos | 100.0 /100 | #14 | Exceptional $57,740 |
| Koreans | 100.0 /100 | #15 | Exceptional $57,730 |
| Immigrants | Afghanistan | 100.0 /100 | #16 | Exceptional $57,478 |
| Sierra Leoneans | 100.0 /100 | #17 | Exceptional $57,272 |
| Immigrants | Eastern Asia | 100.0 /100 | #18 | Exceptional $57,123 |
| Bhutanese | 100.0 /100 | #19 | Exceptional $57,078 |
| Immigrants | Ireland | 100.0 /100 | #20 | Exceptional $57,075 |
| Immigrants | Fiji | 100.0 /100 | #21 | Exceptional $57,074 |
| Asians | 100.0 /100 | #22 | Exceptional $57,003 |
| Tongans | 100.0 /100 | #23 | Exceptional $56,972 |
| Immigrants | Singapore | 100.0 /100 | #24 | Exceptional $56,835 |
| Immigrants | Pakistan | 100.0 /100 | #25 | Exceptional $56,789 |
| Immigrants | Australia | 100.0 /100 | #26 | Exceptional $56,660 |