Pennsylvania German vs Dutch West Indian Median Earnings
COMPARE
Pennsylvania German
Dutch West Indian
Median Earnings
Median Earnings Comparison
Pennsylvania Germans
Dutch West Indians
$42,615
MEDIAN EARNINGS
0.5/ 100
METRIC RATING
271st/ 347
METRIC RANK
$40,107
MEDIAN EARNINGS
0.0/ 100
METRIC RATING
318th/ 347
METRIC RANK
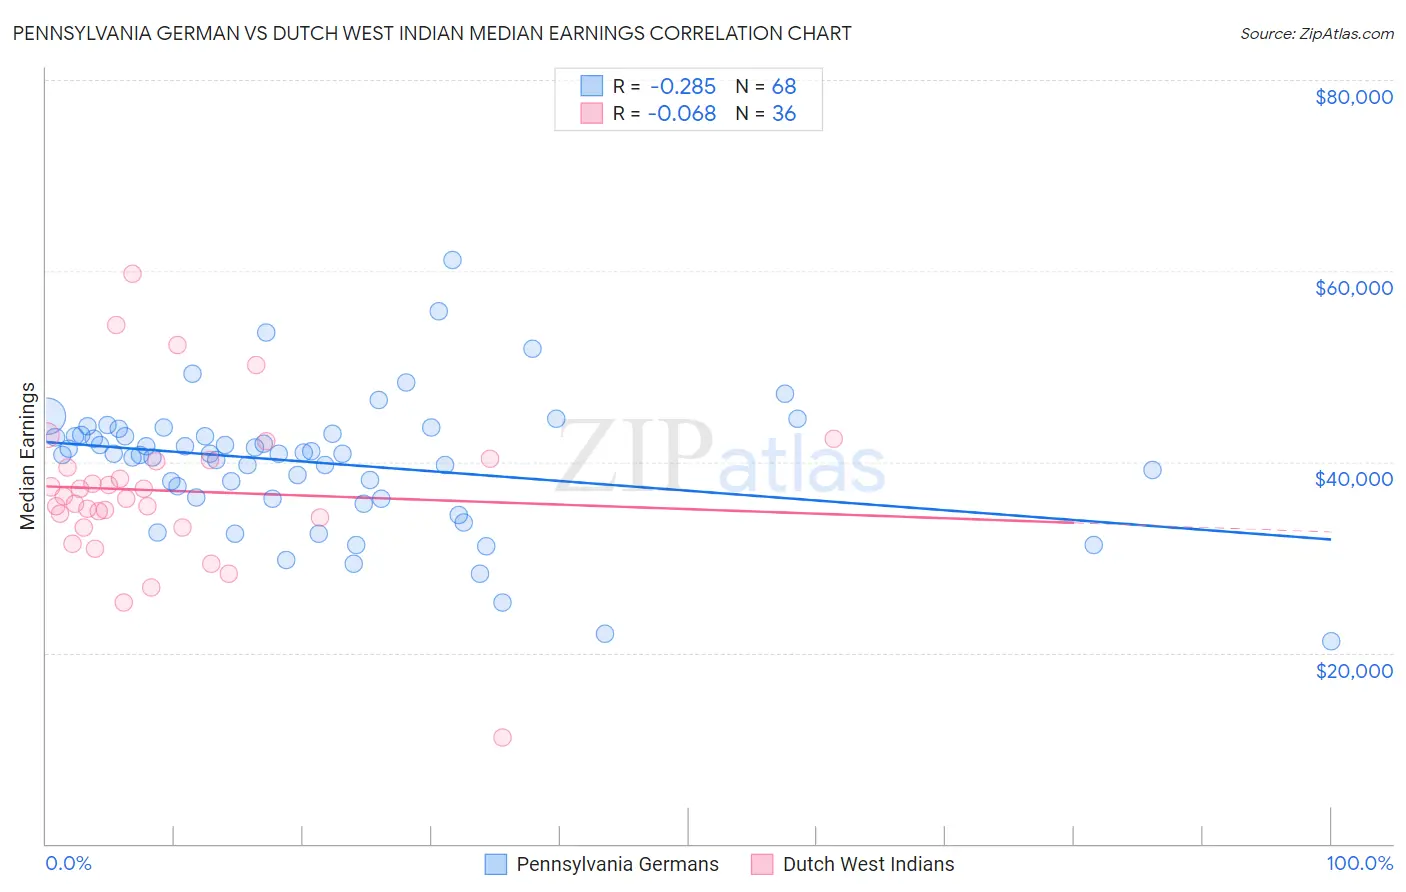
Pennsylvania German vs Dutch West Indian Median Earnings Correlation Chart
The statistical analysis conducted on geographies consisting of 234,087,071 people shows a weak negative correlation between the proportion of Pennsylvania Germans and median earnings in the United States with a correlation coefficient (R) of -0.285 and weighted average of $42,615. Similarly, the statistical analysis conducted on geographies consisting of 85,770,657 people shows a slight negative correlation between the proportion of Dutch West Indians and median earnings in the United States with a correlation coefficient (R) of -0.068 and weighted average of $40,107, a difference of 6.2%.
Median Earnings Correlation Summary
| Measurement | Pennsylvania German | Dutch West Indian |
| Minimum | $21,250 | $11,071 |
| Maximum | $61,146 | $59,688 |
| Range | $39,896 | $48,617 |
| Mean | $39,881 | $36,968 |
| Median | $40,836 | $36,241 |
| Interquartile 25% (IQ1) | $36,214 | $33,646 |
| Interquartile 75% (IQ3) | $42,893 | $40,145 |
| Interquartile Range (IQR) | $6,679 | $6,499 |
| Standard Deviation (Sample) | $6,983 | $8,507 |
| Standard Deviation (Population) | $6,932 | $8,388 |
Similar Demographics by Median Earnings
Demographics Similar to Pennsylvania Germans by Median Earnings
In terms of median earnings, the demographic groups most similar to Pennsylvania Germans are Osage ($42,651, a difference of 0.090%), Belizean ($42,702, a difference of 0.21%), American ($42,742, a difference of 0.30%), Cree ($42,777, a difference of 0.38%), and Iroquois ($42,430, a difference of 0.43%).
| Demographics | Rating | Rank | Median Earnings |
| Immigrants | Liberia | 0.7 /100 | #264 | Tragic $42,923 |
| Salvadorans | 0.7 /100 | #265 | Tragic $42,912 |
| Immigrants | Laos | 0.7 /100 | #266 | Tragic $42,884 |
| Cree | 0.6 /100 | #267 | Tragic $42,777 |
| Americans | 0.6 /100 | #268 | Tragic $42,742 |
| Belizeans | 0.5 /100 | #269 | Tragic $42,702 |
| Osage | 0.5 /100 | #270 | Tragic $42,651 |
| Pennsylvania Germans | 0.5 /100 | #271 | Tragic $42,615 |
| Iroquois | 0.4 /100 | #272 | Tragic $42,430 |
| Immigrants | Dominica | 0.4 /100 | #273 | Tragic $42,420 |
| Immigrants | El Salvador | 0.4 /100 | #274 | Tragic $42,413 |
| Immigrants | Belize | 0.3 /100 | #275 | Tragic $42,339 |
| Spanish Americans | 0.3 /100 | #276 | Tragic $42,316 |
| Central Americans | 0.3 /100 | #277 | Tragic $42,280 |
| Cajuns | 0.3 /100 | #278 | Tragic $42,189 |
Demographics Similar to Dutch West Indians by Median Earnings
In terms of median earnings, the demographic groups most similar to Dutch West Indians are Black/African American ($40,085, a difference of 0.060%), Fijian ($40,193, a difference of 0.21%), Immigrants from Honduras ($40,195, a difference of 0.22%), Cheyenne ($40,233, a difference of 0.31%), and Seminole ($40,233, a difference of 0.31%).
| Demographics | Rating | Rank | Median Earnings |
| Hispanics or Latinos | 0.0 /100 | #311 | Tragic $40,288 |
| Chippewa | 0.0 /100 | #312 | Tragic $40,287 |
| Choctaw | 0.0 /100 | #313 | Tragic $40,270 |
| Cheyenne | 0.0 /100 | #314 | Tragic $40,233 |
| Seminole | 0.0 /100 | #315 | Tragic $40,233 |
| Immigrants | Honduras | 0.0 /100 | #316 | Tragic $40,195 |
| Fijians | 0.0 /100 | #317 | Tragic $40,193 |
| Dutch West Indians | 0.0 /100 | #318 | Tragic $40,107 |
| Blacks/African Americans | 0.0 /100 | #319 | Tragic $40,085 |
| Immigrants | Bahamas | 0.0 /100 | #320 | Tragic $39,861 |
| Mexicans | 0.0 /100 | #321 | Tragic $39,834 |
| Immigrants | Central America | 0.0 /100 | #322 | Tragic $39,762 |
| Bahamians | 0.0 /100 | #323 | Tragic $39,735 |
| Ottawa | 0.0 /100 | #324 | Tragic $39,721 |
| Creek | 0.0 /100 | #325 | Tragic $39,648 |