Paraguayan vs Immigrants from Scotland Median Male Earnings
COMPARE
Paraguayan
Immigrants from Scotland
Median Male Earnings
Median Male Earnings Comparison
Paraguayans
Immigrants from Scotland
$59,975
MEDIAN MALE EARNINGS
99.5/ 100
METRIC RATING
77th/ 347
METRIC RANK
$61,220
MEDIAN MALE EARNINGS
99.9/ 100
METRIC RATING
57th/ 347
METRIC RANK
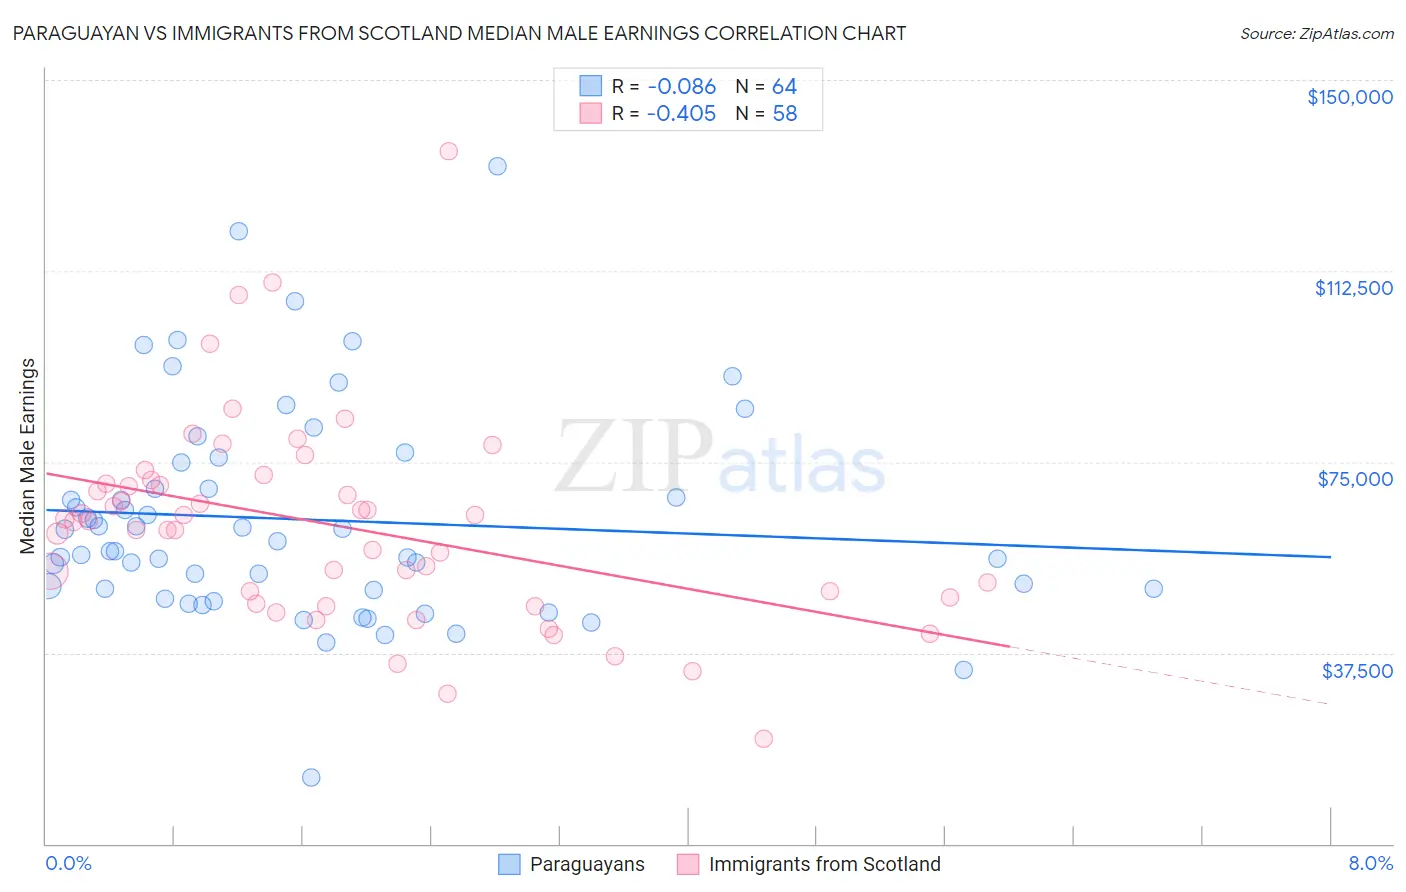
Paraguayan vs Immigrants from Scotland Median Male Earnings Correlation Chart
The statistical analysis conducted on geographies consisting of 95,078,142 people shows a slight negative correlation between the proportion of Paraguayans and median male earnings in the United States with a correlation coefficient (R) of -0.086 and weighted average of $59,975. Similarly, the statistical analysis conducted on geographies consisting of 196,362,899 people shows a moderate negative correlation between the proportion of Immigrants from Scotland and median male earnings in the United States with a correlation coefficient (R) of -0.405 and weighted average of $61,220, a difference of 2.1%.
Median Male Earnings Correlation Summary
| Measurement | Paraguayan | Immigrants from Scotland |
| Minimum | $13,000 | $20,588 |
| Maximum | $133,125 | $136,042 |
| Range | $120,125 | $115,454 |
| Mean | $63,648 | $62,522 |
| Median | $58,508 | $63,347 |
| Interquartile 25% (IQ1) | $49,873 | $48,304 |
| Interquartile 75% (IQ3) | $72,390 | $70,634 |
| Interquartile Range (IQR) | $22,517 | $22,330 |
| Standard Deviation (Sample) | $21,137 | $20,135 |
| Standard Deviation (Population) | $20,971 | $19,960 |
Demographics Similar to Paraguayans and Immigrants from Scotland by Median Male Earnings
In terms of median male earnings, the demographic groups most similar to Paraguayans are Romanian ($60,063, a difference of 0.15%), Immigrants from Bolivia ($60,088, a difference of 0.19%), Argentinean ($60,117, a difference of 0.24%), Immigrants from North America ($60,265, a difference of 0.48%), and Immigrants from Western Europe ($60,334, a difference of 0.60%). Similarly, the demographic groups most similar to Immigrants from Scotland are New Zealander ($61,199, a difference of 0.030%), Immigrants from Netherlands ($61,096, a difference of 0.20%), Egyptian ($61,095, a difference of 0.20%), Bolivian ($61,066, a difference of 0.25%), and Immigrants from Romania ($61,040, a difference of 0.30%).
| Demographics | Rating | Rank | Median Male Earnings |
| Immigrants | Scotland | 99.9 /100 | #57 | Exceptional $61,220 |
| New Zealanders | 99.9 /100 | #58 | Exceptional $61,199 |
| Immigrants | Netherlands | 99.8 /100 | #59 | Exceptional $61,096 |
| Egyptians | 99.8 /100 | #60 | Exceptional $61,095 |
| Bolivians | 99.8 /100 | #61 | Exceptional $61,066 |
| Immigrants | Romania | 99.8 /100 | #62 | Exceptional $61,040 |
| Immigrants | Pakistan | 99.8 /100 | #63 | Exceptional $60,987 |
| Immigrants | Eastern Europe | 99.8 /100 | #64 | Exceptional $60,958 |
| Immigrants | Indonesia | 99.8 /100 | #65 | Exceptional $60,935 |
| Immigrants | Croatia | 99.8 /100 | #66 | Exceptional $60,914 |
| Immigrants | Spain | 99.8 /100 | #67 | Exceptional $60,750 |
| Immigrants | Serbia | 99.7 /100 | #68 | Exceptional $60,600 |
| Immigrants | Canada | 99.7 /100 | #69 | Exceptional $60,388 |
| Immigrants | Bulgaria | 99.7 /100 | #70 | Exceptional $60,358 |
| Mongolians | 99.7 /100 | #71 | Exceptional $60,350 |
| Immigrants | Western Europe | 99.7 /100 | #72 | Exceptional $60,334 |
| Immigrants | North America | 99.7 /100 | #73 | Exceptional $60,265 |
| Argentineans | 99.6 /100 | #74 | Exceptional $60,117 |
| Immigrants | Bolivia | 99.6 /100 | #75 | Exceptional $60,088 |
| Romanians | 99.6 /100 | #76 | Exceptional $60,063 |
| Paraguayans | 99.5 /100 | #77 | Exceptional $59,975 |