Panamanian vs Tohono O'odham Householder Income Ages 25 - 44 years
COMPARE
Panamanian
Tohono O'odham
Householder Income Ages 25 - 44 years
Householder Income Ages 25 - 44 years Comparison
Panamanians
Tohono O'odham
$90,193
HOUSEHOLDER INCOME AGES 25 - 44 YEARS
8.1/ 100
METRIC RATING
215th/ 347
METRIC RANK
$69,068
HOUSEHOLDER INCOME AGES 25 - 44 YEARS
0.0/ 100
METRIC RATING
343rd/ 347
METRIC RANK
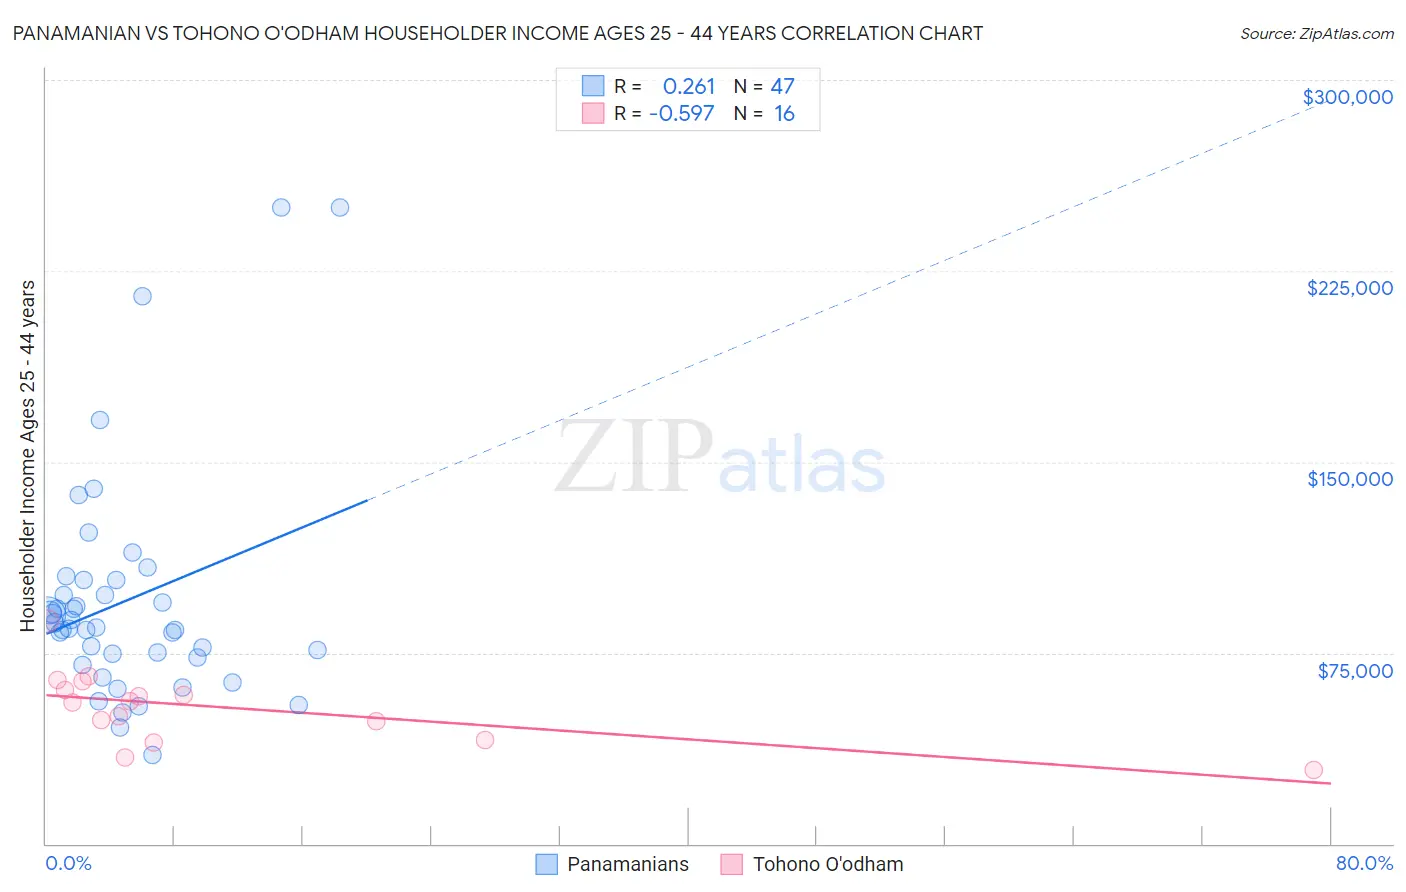
Panamanian vs Tohono O'odham Householder Income Ages 25 - 44 years Correlation Chart
The statistical analysis conducted on geographies consisting of 280,855,443 people shows a weak positive correlation between the proportion of Panamanians and household income with householder between the ages 25 and 44 in the United States with a correlation coefficient (R) of 0.261 and weighted average of $90,193. Similarly, the statistical analysis conducted on geographies consisting of 58,664,625 people shows a substantial negative correlation between the proportion of Tohono O'odham and household income with householder between the ages 25 and 44 in the United States with a correlation coefficient (R) of -0.597 and weighted average of $69,068, a difference of 30.6%.
Householder Income Ages 25 - 44 years Correlation Summary
| Measurement | Panamanian | Tohono O'odham |
| Minimum | $34,890 | $28,875 |
| Maximum | $250,001 | $87,566 |
| Range | $215,111 | $58,691 |
| Mean | $95,499 | $53,659 |
| Median | $85,019 | $55,659 |
| Interquartile 25% (IQ1) | $72,969 | $44,428 |
| Interquartile 75% (IQ3) | $103,669 | $62,013 |
| Interquartile Range (IQR) | $30,700 | $17,585 |
| Standard Deviation (Sample) | $45,169 | $14,270 |
| Standard Deviation (Population) | $44,686 | $13,817 |
Similar Demographics by Householder Income Ages 25 - 44 years
Demographics Similar to Panamanians by Householder Income Ages 25 - 44 years
In terms of householder income ages 25 - 44 years, the demographic groups most similar to Panamanians are Ghanaian ($90,137, a difference of 0.060%), Immigrants from Africa ($90,372, a difference of 0.20%), Scotch-Irish ($89,969, a difference of 0.25%), Immigrants from Bangladesh ($90,448, a difference of 0.28%), and Guyanese ($89,940, a difference of 0.28%).
| Demographics | Rating | Rank | Householder Income Ages 25 - 44 years |
| Immigrants | Thailand | 14.3 /100 | #208 | Poor $91,337 |
| Immigrants | Uruguay | 13.2 /100 | #209 | Poor $91,171 |
| Immigrants | Kenya | 10.9 /100 | #210 | Poor $90,767 |
| Iraqis | 10.8 /100 | #211 | Poor $90,764 |
| Hawaiians | 10.6 /100 | #212 | Poor $90,722 |
| Immigrants | Bangladesh | 9.3 /100 | #213 | Tragic $90,448 |
| Immigrants | Africa | 8.9 /100 | #214 | Tragic $90,372 |
| Panamanians | 8.1 /100 | #215 | Tragic $90,193 |
| Ghanaians | 7.9 /100 | #216 | Tragic $90,137 |
| Scotch-Irish | 7.3 /100 | #217 | Tragic $89,969 |
| Guyanese | 7.1 /100 | #218 | Tragic $89,940 |
| Delaware | 6.9 /100 | #219 | Tragic $89,876 |
| Trinidadians and Tobagonians | 6.8 /100 | #220 | Tragic $89,856 |
| Immigrants | Trinidad and Tobago | 6.5 /100 | #221 | Tragic $89,748 |
| Immigrants | Ecuador | 6.2 /100 | #222 | Tragic $89,673 |
Demographics Similar to Tohono O'odham by Householder Income Ages 25 - 44 years
In terms of householder income ages 25 - 44 years, the demographic groups most similar to Tohono O'odham are Pueblo ($68,910, a difference of 0.23%), Crow ($71,337, a difference of 3.3%), Arapaho ($71,697, a difference of 3.8%), Navajo ($66,529, a difference of 3.8%), and Immigrants from Congo ($72,178, a difference of 4.5%).
| Demographics | Rating | Rank | Householder Income Ages 25 - 44 years |
| Hopi | 0.0 /100 | #333 | Tragic $75,002 |
| Creek | 0.0 /100 | #334 | Tragic $74,847 |
| Kiowa | 0.0 /100 | #335 | Tragic $74,776 |
| Yup'ik | 0.0 /100 | #336 | Tragic $73,688 |
| Blacks/African Americans | 0.0 /100 | #337 | Tragic $73,370 |
| Immigrants | Yemen | 0.0 /100 | #338 | Tragic $73,043 |
| Yuman | 0.0 /100 | #339 | Tragic $72,956 |
| Immigrants | Congo | 0.0 /100 | #340 | Tragic $72,178 |
| Arapaho | 0.0 /100 | #341 | Tragic $71,697 |
| Crow | 0.0 /100 | #342 | Tragic $71,337 |
| Tohono O'odham | 0.0 /100 | #343 | Tragic $69,068 |
| Pueblo | 0.0 /100 | #344 | Tragic $68,910 |
| Navajo | 0.0 /100 | #345 | Tragic $66,529 |
| Puerto Ricans | 0.0 /100 | #346 | Tragic $65,996 |
| Lumbee | 0.0 /100 | #347 | Tragic $60,305 |