Thai vs Tohono O'odham Householder Income Ages 25 - 44 years
COMPARE
Thai
Tohono O'odham
Householder Income Ages 25 - 44 years
Householder Income Ages 25 - 44 years Comparison
Thais
Tohono O'odham
$121,778
HOUSEHOLDER INCOME AGES 25 - 44 YEARS
100.0/ 100
METRIC RATING
6th/ 347
METRIC RANK
$69,068
HOUSEHOLDER INCOME AGES 25 - 44 YEARS
0.0/ 100
METRIC RATING
343rd/ 347
METRIC RANK
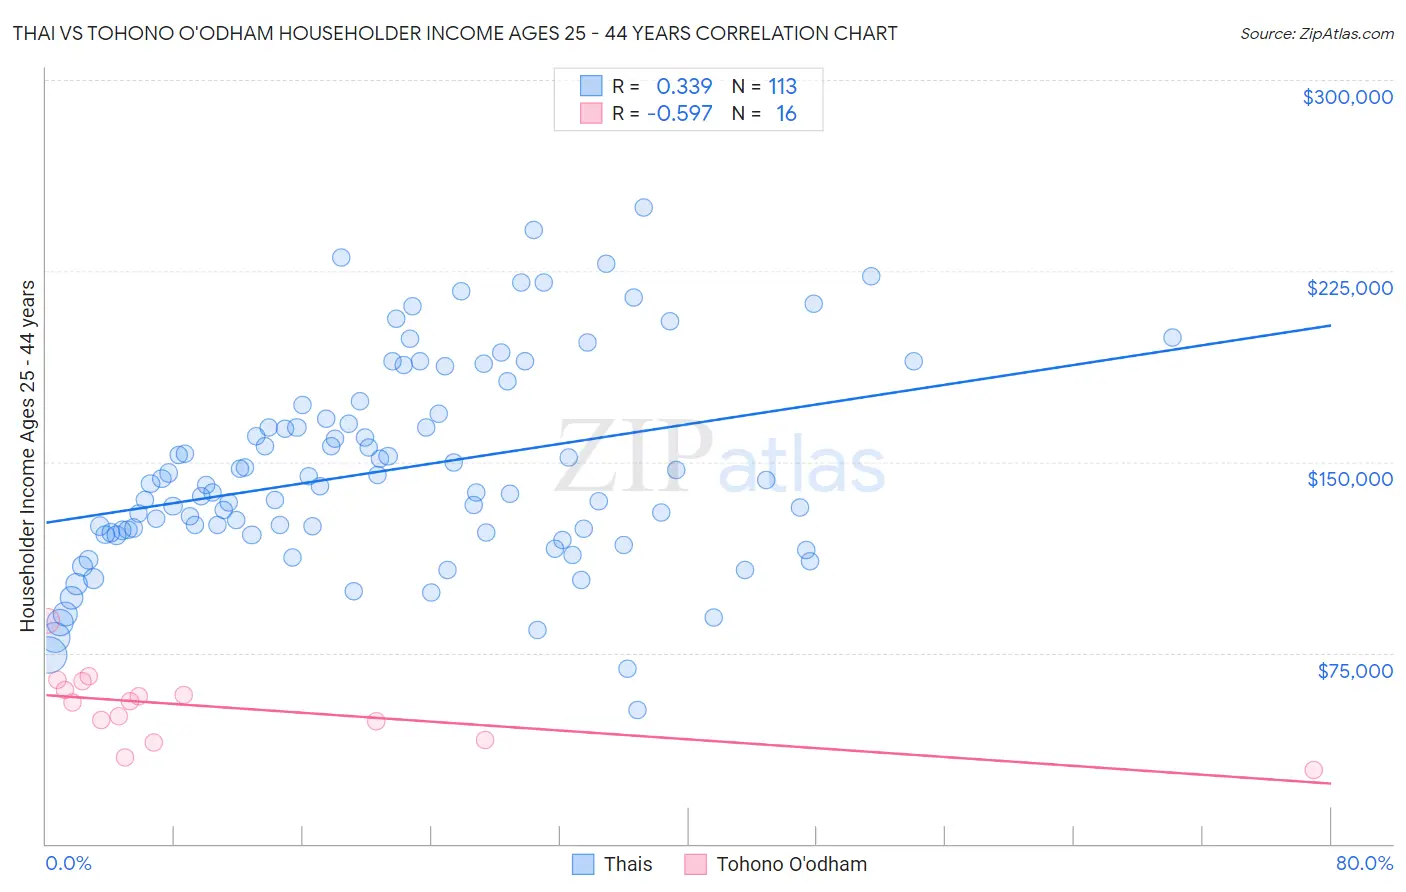
Thai vs Tohono O'odham Householder Income Ages 25 - 44 years Correlation Chart
The statistical analysis conducted on geographies consisting of 474,108,438 people shows a mild positive correlation between the proportion of Thais and household income with householder between the ages 25 and 44 in the United States with a correlation coefficient (R) of 0.339 and weighted average of $121,778. Similarly, the statistical analysis conducted on geographies consisting of 58,664,625 people shows a substantial negative correlation between the proportion of Tohono O'odham and household income with householder between the ages 25 and 44 in the United States with a correlation coefficient (R) of -0.597 and weighted average of $69,068, a difference of 76.3%.
Householder Income Ages 25 - 44 years Correlation Summary
| Measurement | Thai | Tohono O'odham |
| Minimum | $52,604 | $28,875 |
| Maximum | $250,001 | $87,566 |
| Range | $197,397 | $58,691 |
| Mean | $146,679 | $53,659 |
| Median | $140,455 | $55,659 |
| Interquartile 25% (IQ1) | $121,721 | $44,428 |
| Interquartile 75% (IQ3) | $167,903 | $62,013 |
| Interquartile Range (IQR) | $46,181 | $17,585 |
| Standard Deviation (Sample) | $39,916 | $14,270 |
| Standard Deviation (Population) | $39,739 | $13,817 |
Similar Demographics by Householder Income Ages 25 - 44 years
Demographics Similar to Thais by Householder Income Ages 25 - 44 years
In terms of householder income ages 25 - 44 years, the demographic groups most similar to Thais are Immigrants from Ireland ($120,333, a difference of 1.2%), Iranian ($120,292, a difference of 1.2%), Immigrants from China ($119,756, a difference of 1.7%), Indian (Asian) ($119,496, a difference of 1.9%), and Immigrants from India ($124,238, a difference of 2.0%).
| Demographics | Rating | Rank | Householder Income Ages 25 - 44 years |
| Immigrants | Taiwan | 100.0 /100 | #1 | Exceptional $129,122 |
| Filipinos | 100.0 /100 | #2 | Exceptional $128,723 |
| Immigrants | Hong Kong | 100.0 /100 | #3 | Exceptional $128,140 |
| Immigrants | Singapore | 100.0 /100 | #4 | Exceptional $124,429 |
| Immigrants | India | 100.0 /100 | #5 | Exceptional $124,238 |
| Thais | 100.0 /100 | #6 | Exceptional $121,778 |
| Immigrants | Ireland | 100.0 /100 | #7 | Exceptional $120,333 |
| Iranians | 100.0 /100 | #8 | Exceptional $120,292 |
| Immigrants | China | 100.0 /100 | #9 | Exceptional $119,756 |
| Indians (Asian) | 100.0 /100 | #10 | Exceptional $119,496 |
| Okinawans | 100.0 /100 | #11 | Exceptional $119,349 |
| Immigrants | Iran | 100.0 /100 | #12 | Exceptional $119,204 |
| Immigrants | Eastern Asia | 100.0 /100 | #13 | Exceptional $118,056 |
| Immigrants | Israel | 100.0 /100 | #14 | Exceptional $117,219 |
| Immigrants | South Central Asia | 100.0 /100 | #15 | Exceptional $116,626 |
Demographics Similar to Tohono O'odham by Householder Income Ages 25 - 44 years
In terms of householder income ages 25 - 44 years, the demographic groups most similar to Tohono O'odham are Pueblo ($68,910, a difference of 0.23%), Crow ($71,337, a difference of 3.3%), Arapaho ($71,697, a difference of 3.8%), Navajo ($66,529, a difference of 3.8%), and Immigrants from Congo ($72,178, a difference of 4.5%).
| Demographics | Rating | Rank | Householder Income Ages 25 - 44 years |
| Hopi | 0.0 /100 | #333 | Tragic $75,002 |
| Creek | 0.0 /100 | #334 | Tragic $74,847 |
| Kiowa | 0.0 /100 | #335 | Tragic $74,776 |
| Yup'ik | 0.0 /100 | #336 | Tragic $73,688 |
| Blacks/African Americans | 0.0 /100 | #337 | Tragic $73,370 |
| Immigrants | Yemen | 0.0 /100 | #338 | Tragic $73,043 |
| Yuman | 0.0 /100 | #339 | Tragic $72,956 |
| Immigrants | Congo | 0.0 /100 | #340 | Tragic $72,178 |
| Arapaho | 0.0 /100 | #341 | Tragic $71,697 |
| Crow | 0.0 /100 | #342 | Tragic $71,337 |
| Tohono O'odham | 0.0 /100 | #343 | Tragic $69,068 |
| Pueblo | 0.0 /100 | #344 | Tragic $68,910 |
| Navajo | 0.0 /100 | #345 | Tragic $66,529 |
| Puerto Ricans | 0.0 /100 | #346 | Tragic $65,996 |
| Lumbee | 0.0 /100 | #347 | Tragic $60,305 |