Nicaraguan vs Tohono O'odham Householder Income Ages 25 - 44 years
COMPARE
Nicaraguan
Tohono O'odham
Householder Income Ages 25 - 44 years
Householder Income Ages 25 - 44 years Comparison
Nicaraguans
Tohono O'odham
$87,751
HOUSEHOLDER INCOME AGES 25 - 44 YEARS
2.2/ 100
METRIC RATING
240th/ 347
METRIC RANK
$69,068
HOUSEHOLDER INCOME AGES 25 - 44 YEARS
0.0/ 100
METRIC RATING
343rd/ 347
METRIC RANK
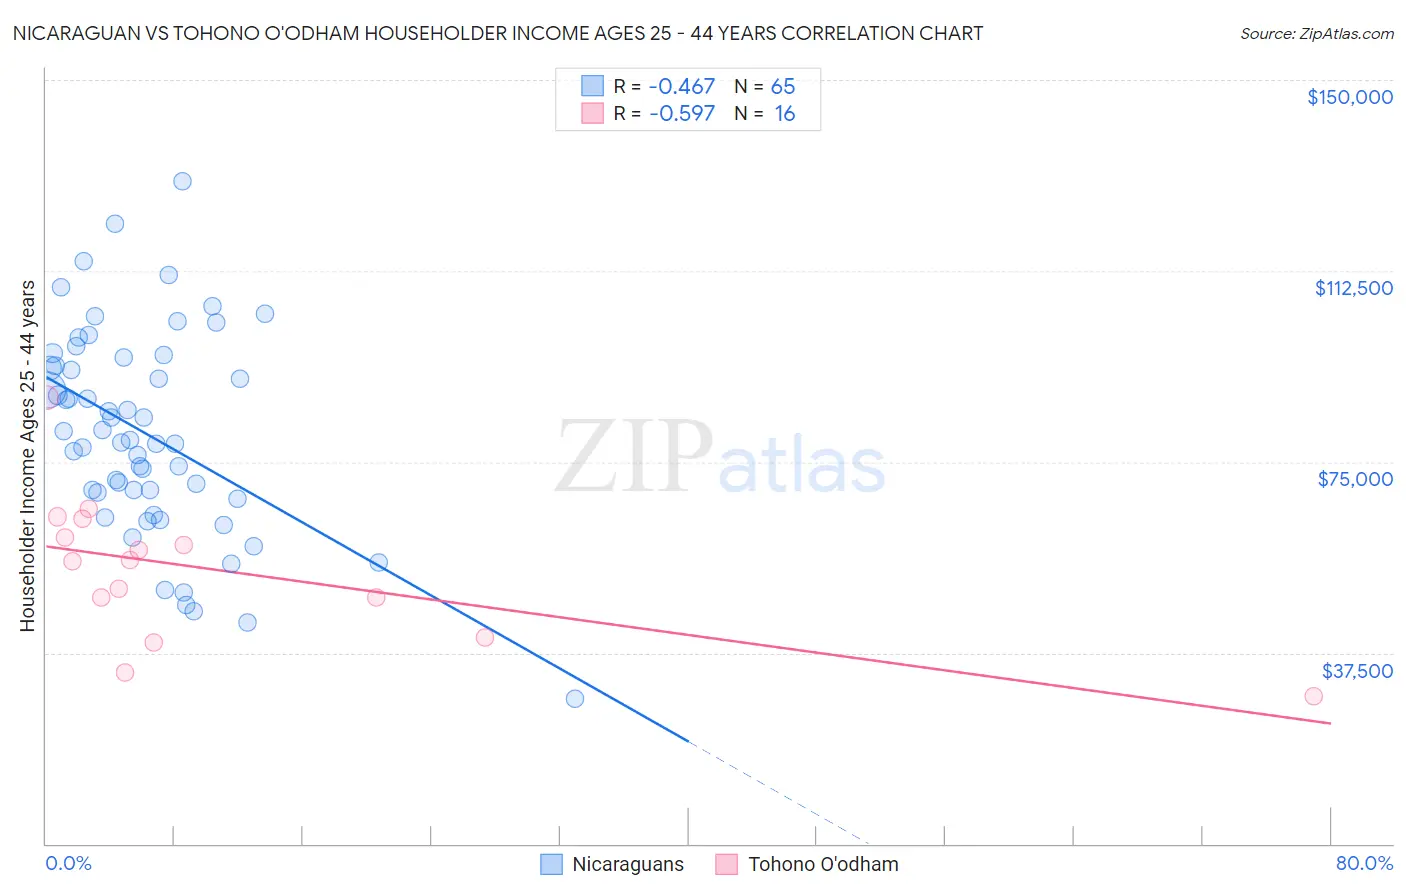
Nicaraguan vs Tohono O'odham Householder Income Ages 25 - 44 years Correlation Chart
The statistical analysis conducted on geographies consisting of 285,307,176 people shows a moderate negative correlation between the proportion of Nicaraguans and household income with householder between the ages 25 and 44 in the United States with a correlation coefficient (R) of -0.467 and weighted average of $87,751. Similarly, the statistical analysis conducted on geographies consisting of 58,664,625 people shows a substantial negative correlation between the proportion of Tohono O'odham and household income with householder between the ages 25 and 44 in the United States with a correlation coefficient (R) of -0.597 and weighted average of $69,068, a difference of 27.1%.
Householder Income Ages 25 - 44 years Correlation Summary
| Measurement | Nicaraguan | Tohono O'odham |
| Minimum | $28,500 | $28,875 |
| Maximum | $130,179 | $87,566 |
| Range | $101,679 | $58,691 |
| Mean | $80,440 | $53,659 |
| Median | $79,185 | $55,659 |
| Interquartile 25% (IQ1) | $68,448 | $44,428 |
| Interquartile 75% (IQ3) | $94,672 | $62,013 |
| Interquartile Range (IQR) | $26,224 | $17,585 |
| Standard Deviation (Sample) | $20,031 | $14,270 |
| Standard Deviation (Population) | $19,876 | $13,817 |
Similar Demographics by Householder Income Ages 25 - 44 years
Demographics Similar to Nicaraguans by Householder Income Ages 25 - 44 years
In terms of householder income ages 25 - 44 years, the demographic groups most similar to Nicaraguans are Immigrants from Ghana ($87,760, a difference of 0.010%), Nigerian ($87,730, a difference of 0.020%), Alaska Native ($88,018, a difference of 0.30%), Salvadoran ($88,198, a difference of 0.51%), and Immigrants from Cameroon ($88,214, a difference of 0.53%).
| Demographics | Rating | Rank | Householder Income Ages 25 - 44 years |
| Malaysians | 3.0 /100 | #233 | Tragic $88,291 |
| Venezuelans | 2.9 /100 | #234 | Tragic $88,232 |
| Bermudans | 2.9 /100 | #235 | Tragic $88,231 |
| Immigrants | Cameroon | 2.9 /100 | #236 | Tragic $88,214 |
| Salvadorans | 2.8 /100 | #237 | Tragic $88,198 |
| Alaska Natives | 2.6 /100 | #238 | Tragic $88,018 |
| Immigrants | Ghana | 2.2 /100 | #239 | Tragic $87,760 |
| Nicaraguans | 2.2 /100 | #240 | Tragic $87,751 |
| Nigerians | 2.2 /100 | #241 | Tragic $87,730 |
| West Indians | 1.7 /100 | #242 | Tragic $87,205 |
| Immigrants | West Indies | 1.5 /100 | #243 | Tragic $87,063 |
| Immigrants | Venezuela | 1.5 /100 | #244 | Tragic $87,038 |
| Immigrants | El Salvador | 1.4 /100 | #245 | Tragic $86,913 |
| Immigrants | Burma/Myanmar | 1.3 /100 | #246 | Tragic $86,736 |
| Immigrants | Nigeria | 1.2 /100 | #247 | Tragic $86,589 |
Demographics Similar to Tohono O'odham by Householder Income Ages 25 - 44 years
In terms of householder income ages 25 - 44 years, the demographic groups most similar to Tohono O'odham are Pueblo ($68,910, a difference of 0.23%), Crow ($71,337, a difference of 3.3%), Arapaho ($71,697, a difference of 3.8%), Navajo ($66,529, a difference of 3.8%), and Immigrants from Congo ($72,178, a difference of 4.5%).
| Demographics | Rating | Rank | Householder Income Ages 25 - 44 years |
| Hopi | 0.0 /100 | #333 | Tragic $75,002 |
| Creek | 0.0 /100 | #334 | Tragic $74,847 |
| Kiowa | 0.0 /100 | #335 | Tragic $74,776 |
| Yup'ik | 0.0 /100 | #336 | Tragic $73,688 |
| Blacks/African Americans | 0.0 /100 | #337 | Tragic $73,370 |
| Immigrants | Yemen | 0.0 /100 | #338 | Tragic $73,043 |
| Yuman | 0.0 /100 | #339 | Tragic $72,956 |
| Immigrants | Congo | 0.0 /100 | #340 | Tragic $72,178 |
| Arapaho | 0.0 /100 | #341 | Tragic $71,697 |
| Crow | 0.0 /100 | #342 | Tragic $71,337 |
| Tohono O'odham | 0.0 /100 | #343 | Tragic $69,068 |
| Pueblo | 0.0 /100 | #344 | Tragic $68,910 |
| Navajo | 0.0 /100 | #345 | Tragic $66,529 |
| Puerto Ricans | 0.0 /100 | #346 | Tragic $65,996 |
| Lumbee | 0.0 /100 | #347 | Tragic $60,305 |