Sierra Leonean vs Tohono O'odham Householder Income Ages 25 - 44 years
COMPARE
Sierra Leonean
Tohono O'odham
Householder Income Ages 25 - 44 years
Householder Income Ages 25 - 44 years Comparison
Sierra Leoneans
Tohono O'odham
$93,435
HOUSEHOLDER INCOME AGES 25 - 44 YEARS
34.8/ 100
METRIC RATING
186th/ 347
METRIC RANK
$69,068
HOUSEHOLDER INCOME AGES 25 - 44 YEARS
0.0/ 100
METRIC RATING
343rd/ 347
METRIC RANK
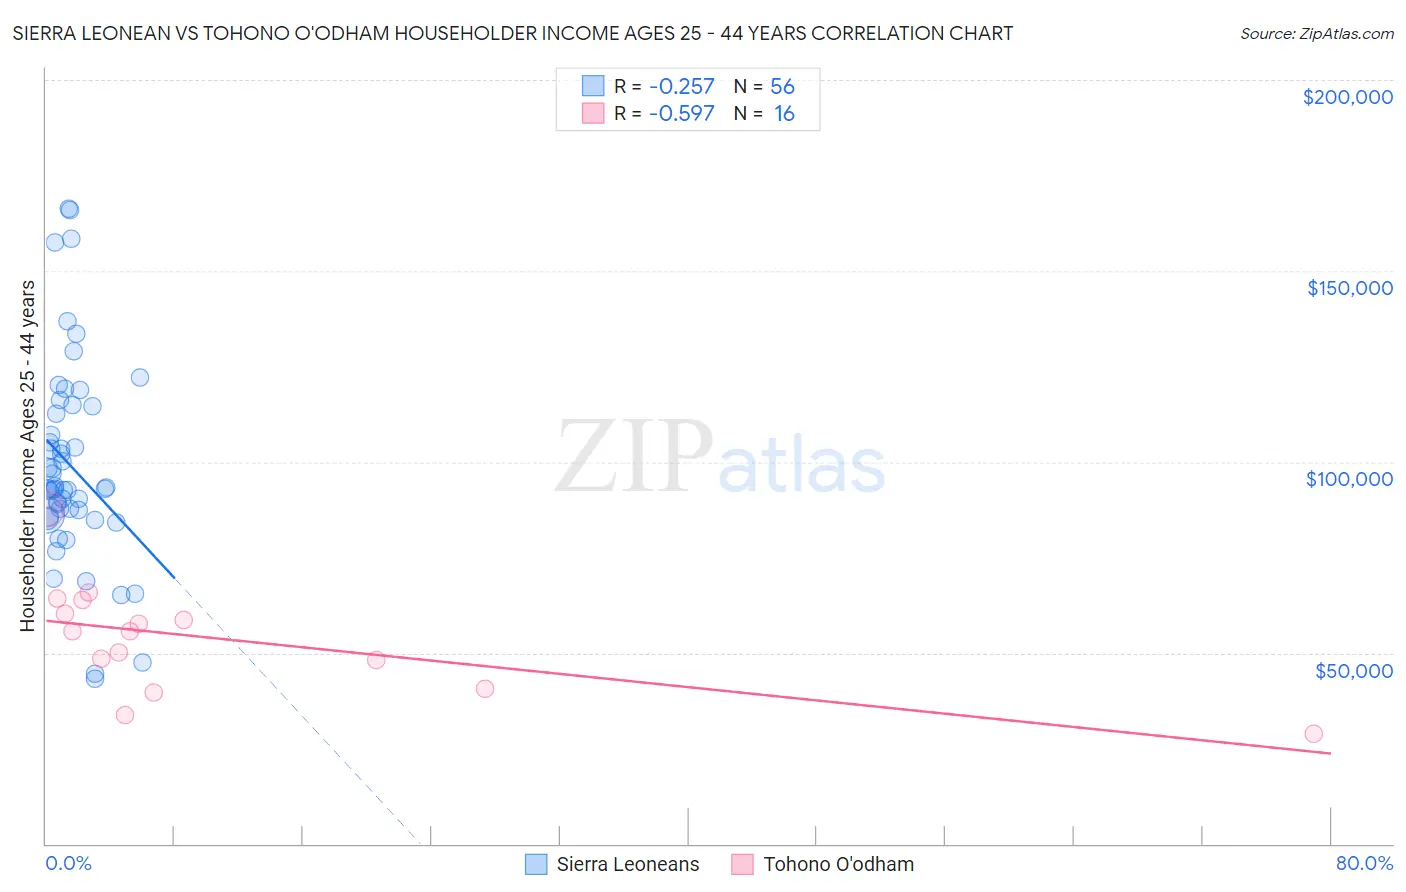
Sierra Leonean vs Tohono O'odham Householder Income Ages 25 - 44 years Correlation Chart
The statistical analysis conducted on geographies consisting of 83,314,226 people shows a weak negative correlation between the proportion of Sierra Leoneans and household income with householder between the ages 25 and 44 in the United States with a correlation coefficient (R) of -0.257 and weighted average of $93,435. Similarly, the statistical analysis conducted on geographies consisting of 58,664,625 people shows a substantial negative correlation between the proportion of Tohono O'odham and household income with householder between the ages 25 and 44 in the United States with a correlation coefficient (R) of -0.597 and weighted average of $69,068, a difference of 35.3%.
Householder Income Ages 25 - 44 years Correlation Summary
| Measurement | Sierra Leonean | Tohono O'odham |
| Minimum | $43,346 | $28,875 |
| Maximum | $166,389 | $87,566 |
| Range | $123,043 | $58,691 |
| Mean | $98,723 | $53,659 |
| Median | $93,030 | $55,659 |
| Interquartile 25% (IQ1) | $85,860 | $44,428 |
| Interquartile 75% (IQ3) | $113,651 | $62,013 |
| Interquartile Range (IQR) | $27,791 | $17,585 |
| Standard Deviation (Sample) | $26,448 | $14,270 |
| Standard Deviation (Population) | $26,211 | $13,817 |
Similar Demographics by Householder Income Ages 25 - 44 years
Demographics Similar to Sierra Leoneans by Householder Income Ages 25 - 44 years
In terms of householder income ages 25 - 44 years, the demographic groups most similar to Sierra Leoneans are Immigrants from Eritrea ($93,466, a difference of 0.030%), Spaniard ($93,366, a difference of 0.070%), German ($93,531, a difference of 0.10%), Guamanian/Chamorro ($93,569, a difference of 0.14%), and Uruguayan ($93,631, a difference of 0.21%).
| Demographics | Rating | Rank | Householder Income Ages 25 - 44 years |
| French Canadians | 38.2 /100 | #179 | Fair $93,694 |
| French | 37.8 /100 | #180 | Fair $93,665 |
| Puget Sound Salish | 37.7 /100 | #181 | Fair $93,661 |
| Uruguayans | 37.3 /100 | #182 | Fair $93,631 |
| Guamanians/Chamorros | 36.5 /100 | #183 | Fair $93,569 |
| Germans | 36.0 /100 | #184 | Fair $93,531 |
| Immigrants | Eritrea | 35.2 /100 | #185 | Fair $93,466 |
| Sierra Leoneans | 34.8 /100 | #186 | Fair $93,435 |
| Spaniards | 34.0 /100 | #187 | Fair $93,366 |
| Immigrants | Sierra Leone | 30.9 /100 | #188 | Fair $93,115 |
| Dutch | 30.5 /100 | #189 | Fair $93,081 |
| Welsh | 30.0 /100 | #190 | Fair $93,039 |
| Tlingit-Haida | 29.4 /100 | #191 | Fair $92,987 |
| Immigrants | Costa Rica | 28.2 /100 | #192 | Fair $92,876 |
| Samoans | 23.0 /100 | #193 | Fair $92,385 |
Demographics Similar to Tohono O'odham by Householder Income Ages 25 - 44 years
In terms of householder income ages 25 - 44 years, the demographic groups most similar to Tohono O'odham are Pueblo ($68,910, a difference of 0.23%), Crow ($71,337, a difference of 3.3%), Arapaho ($71,697, a difference of 3.8%), Navajo ($66,529, a difference of 3.8%), and Immigrants from Congo ($72,178, a difference of 4.5%).
| Demographics | Rating | Rank | Householder Income Ages 25 - 44 years |
| Hopi | 0.0 /100 | #333 | Tragic $75,002 |
| Creek | 0.0 /100 | #334 | Tragic $74,847 |
| Kiowa | 0.0 /100 | #335 | Tragic $74,776 |
| Yup'ik | 0.0 /100 | #336 | Tragic $73,688 |
| Blacks/African Americans | 0.0 /100 | #337 | Tragic $73,370 |
| Immigrants | Yemen | 0.0 /100 | #338 | Tragic $73,043 |
| Yuman | 0.0 /100 | #339 | Tragic $72,956 |
| Immigrants | Congo | 0.0 /100 | #340 | Tragic $72,178 |
| Arapaho | 0.0 /100 | #341 | Tragic $71,697 |
| Crow | 0.0 /100 | #342 | Tragic $71,337 |
| Tohono O'odham | 0.0 /100 | #343 | Tragic $69,068 |
| Pueblo | 0.0 /100 | #344 | Tragic $68,910 |
| Navajo | 0.0 /100 | #345 | Tragic $66,529 |
| Puerto Ricans | 0.0 /100 | #346 | Tragic $65,996 |
| Lumbee | 0.0 /100 | #347 | Tragic $60,305 |