Panamanian vs Vietnamese Householder Income Ages 25 - 44 years
COMPARE
Panamanian
Vietnamese
Householder Income Ages 25 - 44 years
Householder Income Ages 25 - 44 years Comparison
Panamanians
Vietnamese
$90,193
HOUSEHOLDER INCOME AGES 25 - 44 YEARS
8.1/ 100
METRIC RATING
215th/ 347
METRIC RANK
$92,089
HOUSEHOLDER INCOME AGES 25 - 44 YEARS
20.2/ 100
METRIC RATING
198th/ 347
METRIC RANK
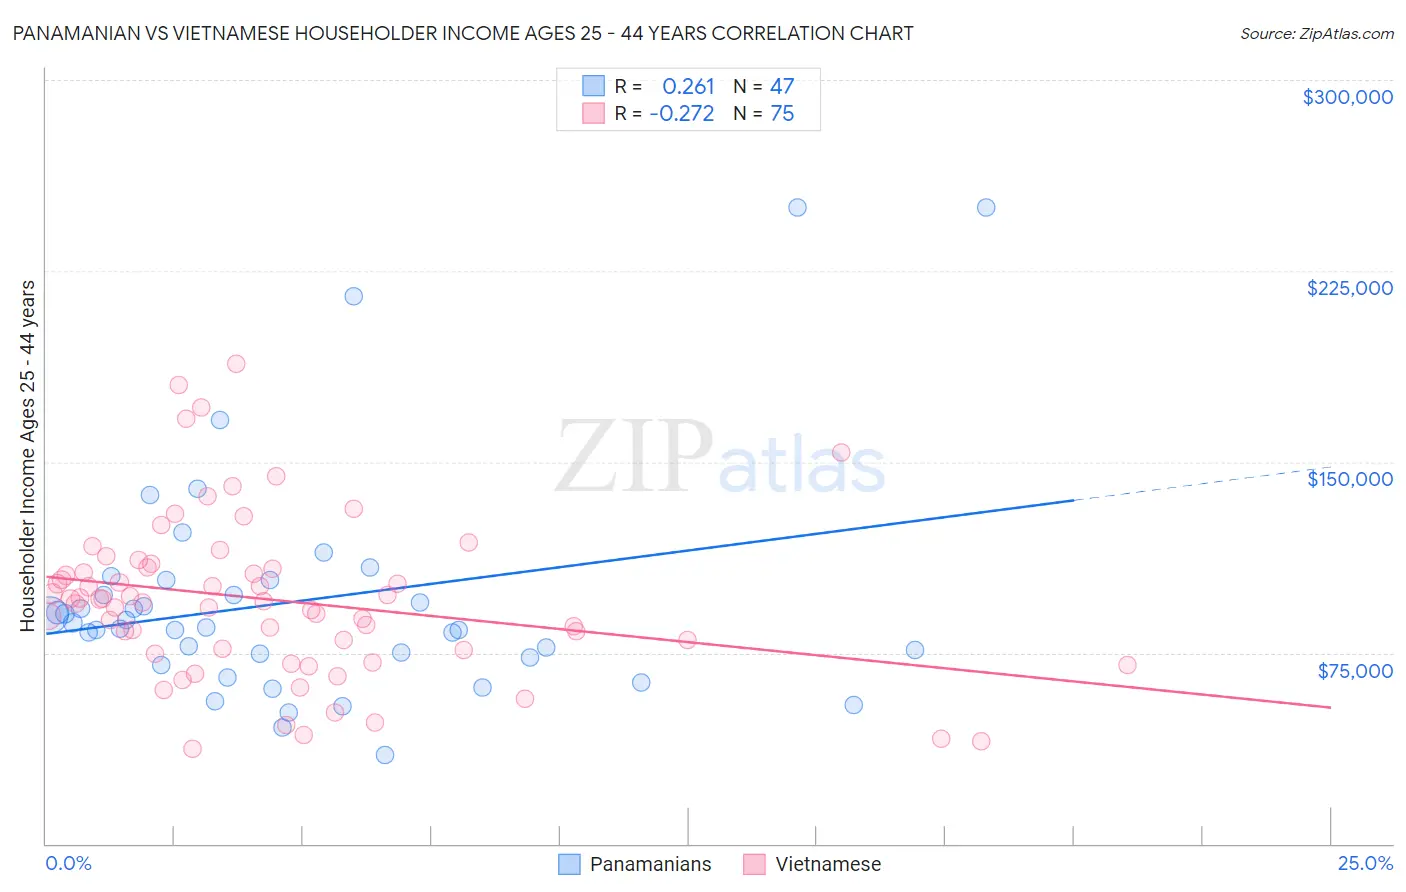
Panamanian vs Vietnamese Householder Income Ages 25 - 44 years Correlation Chart
The statistical analysis conducted on geographies consisting of 280,855,443 people shows a weak positive correlation between the proportion of Panamanians and household income with householder between the ages 25 and 44 in the United States with a correlation coefficient (R) of 0.261 and weighted average of $90,193. Similarly, the statistical analysis conducted on geographies consisting of 170,555,303 people shows a weak negative correlation between the proportion of Vietnamese and household income with householder between the ages 25 and 44 in the United States with a correlation coefficient (R) of -0.272 and weighted average of $92,089, a difference of 2.1%.
Householder Income Ages 25 - 44 years Correlation Summary
| Measurement | Panamanian | Vietnamese |
| Minimum | $34,890 | $37,508 |
| Maximum | $250,001 | $188,772 |
| Range | $215,111 | $151,264 |
| Mean | $95,499 | $95,810 |
| Median | $85,019 | $95,390 |
| Interquartile 25% (IQ1) | $72,969 | $76,300 |
| Interquartile 75% (IQ3) | $103,669 | $108,353 |
| Interquartile Range (IQR) | $30,700 | $32,053 |
| Standard Deviation (Sample) | $45,169 | $31,666 |
| Standard Deviation (Population) | $44,686 | $31,454 |
Demographics Similar to Panamanians and Vietnamese by Householder Income Ages 25 - 44 years
In terms of householder income ages 25 - 44 years, the demographic groups most similar to Panamanians are Ghanaian ($90,137, a difference of 0.060%), Immigrants from Africa ($90,372, a difference of 0.20%), Immigrants from Bangladesh ($90,448, a difference of 0.28%), Hawaiian ($90,722, a difference of 0.59%), and Iraqi ($90,764, a difference of 0.63%). Similarly, the demographic groups most similar to Vietnamese are Immigrants from Colombia ($92,204, a difference of 0.12%), Spanish ($92,200, a difference of 0.12%), Kenyan ($91,684, a difference of 0.44%), White/Caucasian ($91,668, a difference of 0.46%), and Japanese ($91,624, a difference of 0.51%).
| Demographics | Rating | Rank | Householder Income Ages 25 - 44 years |
| Immigrants | Colombia | 21.3 /100 | #196 | Fair $92,204 |
| Spanish | 21.2 /100 | #197 | Fair $92,200 |
| Vietnamese | 20.2 /100 | #198 | Fair $92,089 |
| Kenyans | 16.8 /100 | #199 | Poor $91,684 |
| Whites/Caucasians | 16.7 /100 | #200 | Poor $91,668 |
| Japanese | 16.4 /100 | #201 | Poor $91,624 |
| Ecuadorians | 16.0 /100 | #202 | Poor $91,574 |
| Immigrants | Cambodia | 15.7 /100 | #203 | Poor $91,533 |
| Nepalese | 15.4 /100 | #204 | Poor $91,498 |
| Immigrants | Eastern Africa | 15.2 /100 | #205 | Poor $91,458 |
| Aleuts | 14.5 /100 | #206 | Poor $91,370 |
| Yugoslavians | 14.5 /100 | #207 | Poor $91,368 |
| Immigrants | Thailand | 14.3 /100 | #208 | Poor $91,337 |
| Immigrants | Uruguay | 13.2 /100 | #209 | Poor $91,171 |
| Immigrants | Kenya | 10.9 /100 | #210 | Poor $90,767 |
| Iraqis | 10.8 /100 | #211 | Poor $90,764 |
| Hawaiians | 10.6 /100 | #212 | Poor $90,722 |
| Immigrants | Bangladesh | 9.3 /100 | #213 | Tragic $90,448 |
| Immigrants | Africa | 8.9 /100 | #214 | Tragic $90,372 |
| Panamanians | 8.1 /100 | #215 | Tragic $90,193 |
| Ghanaians | 7.9 /100 | #216 | Tragic $90,137 |