Palestinian vs Cheyenne No Schooling Completed
COMPARE
Palestinian
Cheyenne
No Schooling Completed
No Schooling Completed Comparison
Palestinians
Cheyenne
1.9%
NO SCHOOLING COMPLETED
91.8/ 100
METRIC RATING
130th/ 347
METRIC RANK
2.1%
NO SCHOOLING COMPLETED
58.6/ 100
METRIC RATING
168th/ 347
METRIC RANK
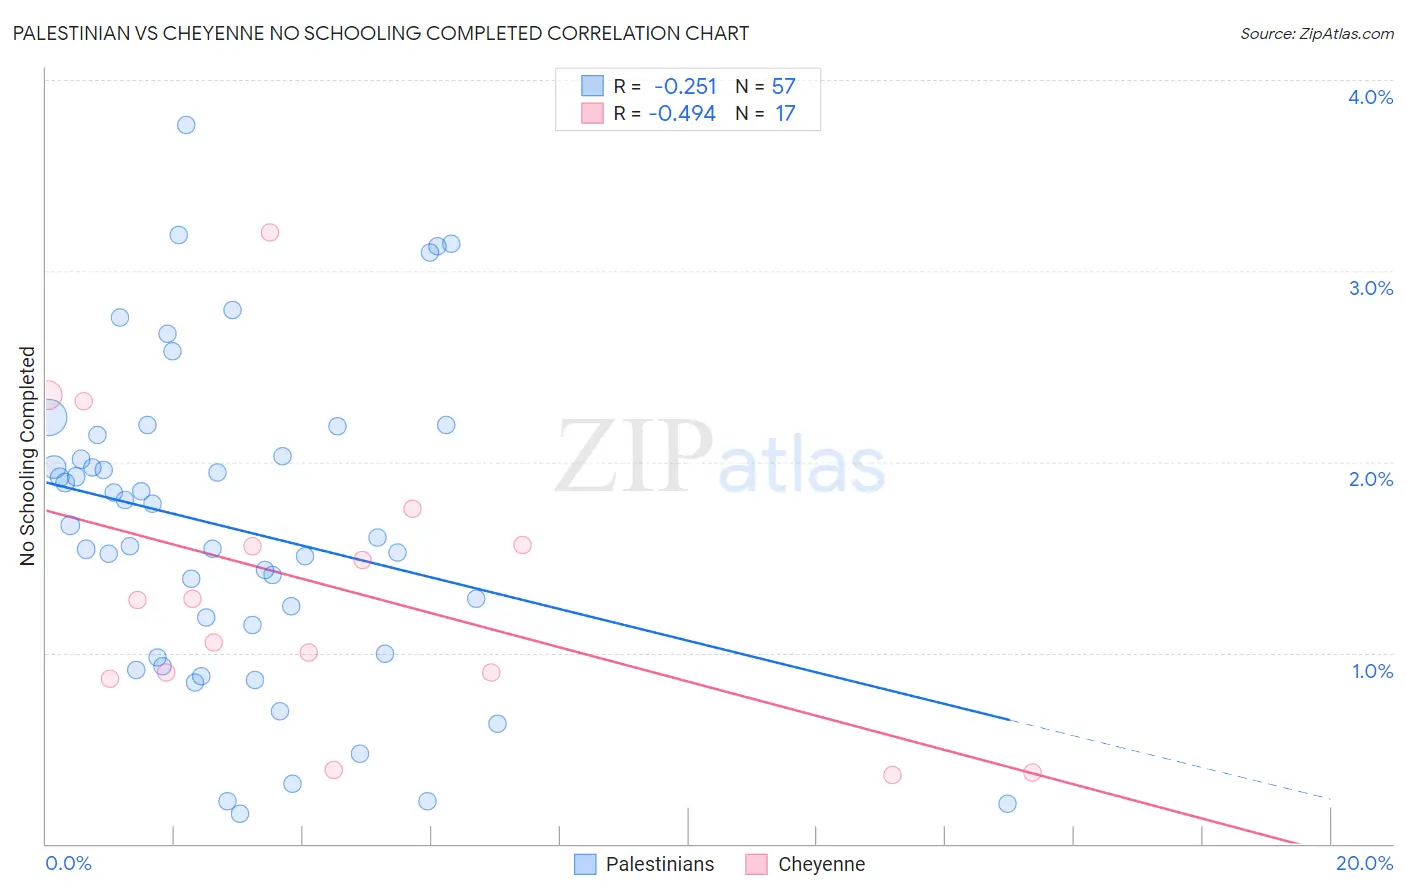
Palestinian vs Cheyenne No Schooling Completed Correlation Chart
The statistical analysis conducted on geographies consisting of 215,613,106 people shows a weak negative correlation between the proportion of Palestinians and percentage of population with no schooling in the United States with a correlation coefficient (R) of -0.251 and weighted average of 1.9%. Similarly, the statistical analysis conducted on geographies consisting of 80,362,041 people shows a moderate negative correlation between the proportion of Cheyenne and percentage of population with no schooling in the United States with a correlation coefficient (R) of -0.494 and weighted average of 2.1%, a difference of 7.5%.
No Schooling Completed Correlation Summary
| Measurement | Palestinian | Cheyenne |
| Minimum | 0.16% | 0.36% |
| Maximum | 3.8% | 3.2% |
| Range | 3.6% | 2.8% |
| Mean | 1.6% | 1.3% |
| Median | 1.6% | 1.3% |
| Interquartile 25% (IQ1) | 0.98% | 0.88% |
| Interquartile 75% (IQ3) | 2.1% | 1.7% |
| Interquartile Range (IQR) | 1.1% | 0.78% |
| Standard Deviation (Sample) | 0.83% | 0.76% |
| Standard Deviation (Population) | 0.82% | 0.74% |
Similar Demographics by No Schooling Completed
Demographics Similar to Palestinians by No Schooling Completed
In terms of no schooling completed, the demographic groups most similar to Palestinians are Seminole (1.9%, a difference of 0.11%), Immigrants from Hungary (1.9%, a difference of 0.11%), Spaniard (1.9%, a difference of 0.25%), Israeli (1.9%, a difference of 0.33%), and Immigrants from Romania (1.9%, a difference of 0.40%).
| Demographics | Rating | Rank | No Schooling Completed |
| Immigrants | Kuwait | 93.9 /100 | #123 | Exceptional 1.9% |
| Cambodians | 93.8 /100 | #124 | Exceptional 1.9% |
| Immigrants | Europe | 93.7 /100 | #125 | Exceptional 1.9% |
| Immigrants | Romania | 92.6 /100 | #126 | Exceptional 1.9% |
| Israelis | 92.4 /100 | #127 | Exceptional 1.9% |
| Spaniards | 92.3 /100 | #128 | Exceptional 1.9% |
| Seminole | 92.0 /100 | #129 | Exceptional 1.9% |
| Palestinians | 91.8 /100 | #130 | Exceptional 1.9% |
| Immigrants | Hungary | 91.6 /100 | #131 | Exceptional 1.9% |
| Colville | 90.4 /100 | #132 | Exceptional 1.9% |
| Immigrants | Turkey | 90.2 /100 | #133 | Exceptional 1.9% |
| Menominee | 89.6 /100 | #134 | Excellent 1.9% |
| Hmong | 88.5 /100 | #135 | Excellent 1.9% |
| Burmese | 88.2 /100 | #136 | Excellent 1.9% |
| Filipinos | 85.5 /100 | #137 | Excellent 2.0% |
Demographics Similar to Cheyenne by No Schooling Completed
In terms of no schooling completed, the demographic groups most similar to Cheyenne are Egyptian (2.1%, a difference of 0.080%), Dutch West Indian (2.1%, a difference of 0.18%), Brazilian (2.1%, a difference of 0.23%), Apache (2.1%, a difference of 0.27%), and Comanche (2.1%, a difference of 0.29%).
| Demographics | Rating | Rank | No Schooling Completed |
| Ugandans | 64.6 /100 | #161 | Good 2.0% |
| Immigrants | Brazil | 63.8 /100 | #162 | Good 2.1% |
| Albanians | 62.2 /100 | #163 | Good 2.1% |
| Comanche | 60.7 /100 | #164 | Good 2.1% |
| Brazilians | 60.2 /100 | #165 | Good 2.1% |
| Dutch West Indians | 59.9 /100 | #166 | Average 2.1% |
| Egyptians | 59.2 /100 | #167 | Average 2.1% |
| Cheyenne | 58.6 /100 | #168 | Average 2.1% |
| Apache | 56.7 /100 | #169 | Average 2.1% |
| Argentineans | 56.0 /100 | #170 | Average 2.1% |
| Immigrants | Poland | 55.2 /100 | #171 | Average 2.1% |
| Immigrants | Argentina | 52.7 /100 | #172 | Average 2.1% |
| Immigrants | Belarus | 51.8 /100 | #173 | Average 2.1% |
| Immigrants | Micronesia | 50.0 /100 | #174 | Average 2.1% |
| Arabs | 46.4 /100 | #175 | Average 2.1% |