Pakistani vs Peruvian Householder Income Over 65 years
COMPARE
Pakistani
Peruvian
Householder Income Over 65 years
Householder Income Over 65 years Comparison
Pakistanis
Peruvians
$63,844
HOUSEHOLDER INCOME OVER 65 YEARS
95.3/ 100
METRIC RATING
107th/ 347
METRIC RANK
$62,766
HOUSEHOLDER INCOME OVER 65 YEARS
86.8/ 100
METRIC RATING
126th/ 347
METRIC RANK
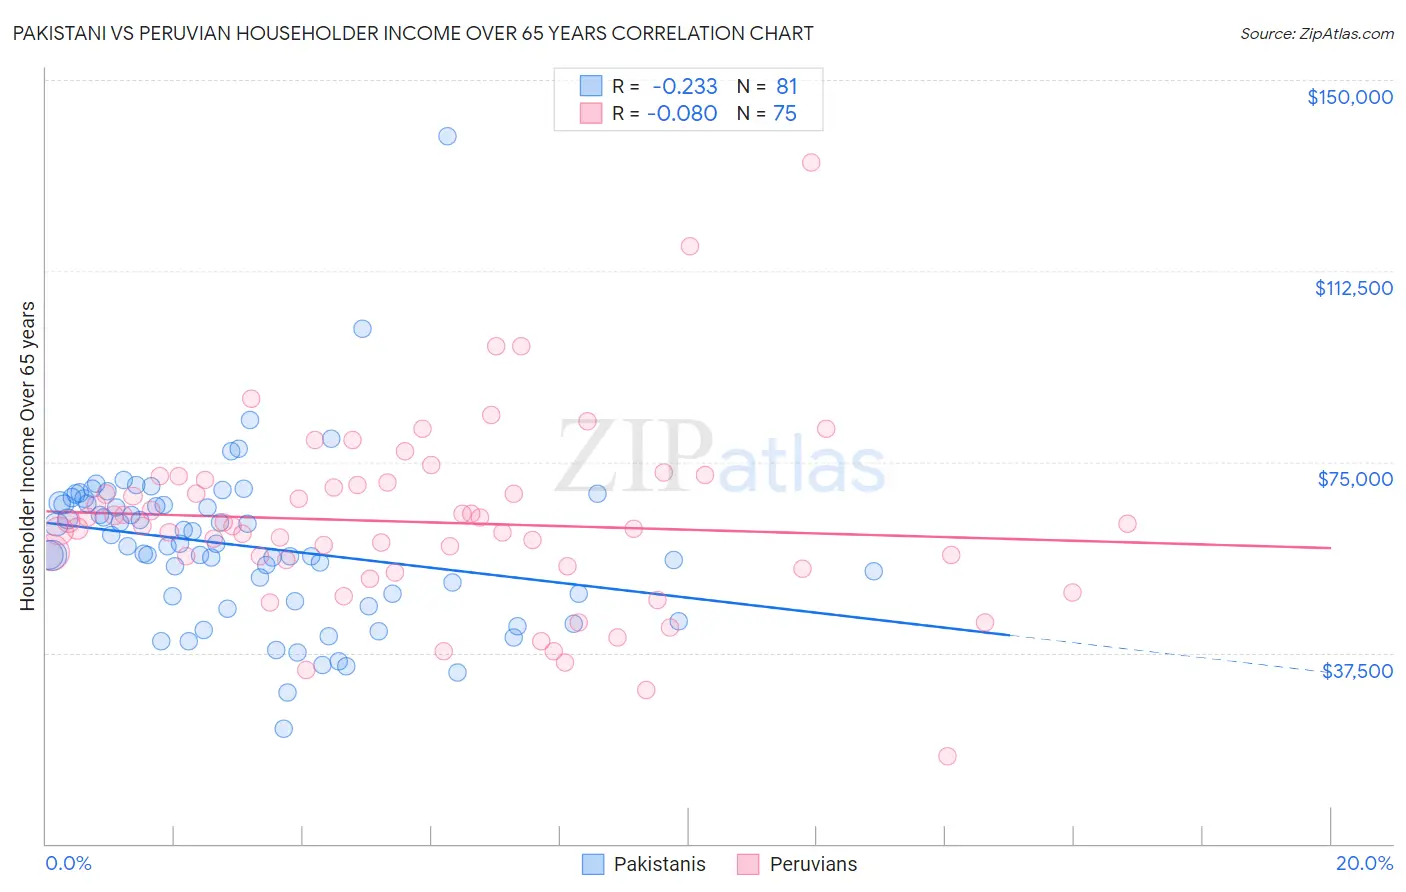
Pakistani vs Peruvian Householder Income Over 65 years Correlation Chart
The statistical analysis conducted on geographies consisting of 334,349,406 people shows a weak negative correlation between the proportion of Pakistanis and household income with householder over the age of 65 in the United States with a correlation coefficient (R) of -0.233 and weighted average of $63,844. Similarly, the statistical analysis conducted on geographies consisting of 361,900,663 people shows a slight negative correlation between the proportion of Peruvians and household income with householder over the age of 65 in the United States with a correlation coefficient (R) of -0.080 and weighted average of $62,766, a difference of 1.7%.
Householder Income Over 65 years Correlation Summary
| Measurement | Pakistani | Peruvian |
| Minimum | $22,611 | $17,083 |
| Maximum | $139,000 | $133,750 |
| Range | $116,389 | $116,667 |
| Mean | $58,427 | $63,177 |
| Median | $58,443 | $62,351 |
| Interquartile 25% (IQ1) | $48,104 | $54,608 |
| Interquartile 75% (IQ3) | $66,893 | $70,924 |
| Interquartile Range (IQR) | $18,789 | $16,316 |
| Standard Deviation (Sample) | $16,214 | $17,972 |
| Standard Deviation (Population) | $16,114 | $17,852 |
Demographics Similar to Pakistanis and Peruvians by Householder Income Over 65 years
In terms of householder income over 65 years, the demographic groups most similar to Pakistanis are Immigrants from Argentina ($63,885, a difference of 0.060%), Palestinian ($63,800, a difference of 0.070%), European ($63,779, a difference of 0.10%), Immigrants from Zimbabwe ($63,643, a difference of 0.32%), and Immigrants from Spain ($63,540, a difference of 0.48%). Similarly, the demographic groups most similar to Peruvians are Soviet Union ($62,848, a difference of 0.13%), Taiwanese ($62,894, a difference of 0.20%), Tlingit-Haida ($62,922, a difference of 0.25%), Immigrants from Moldova ($62,939, a difference of 0.28%), and Immigrants from Vietnam ($63,014, a difference of 0.40%).
| Demographics | Rating | Rank | Householder Income Over 65 years |
| Immigrants | Argentina | 95.5 /100 | #106 | Exceptional $63,885 |
| Pakistanis | 95.3 /100 | #107 | Exceptional $63,844 |
| Palestinians | 95.1 /100 | #108 | Exceptional $63,800 |
| Europeans | 95.0 /100 | #109 | Exceptional $63,779 |
| Immigrants | Zimbabwe | 94.3 /100 | #110 | Exceptional $63,643 |
| Immigrants | Spain | 93.7 /100 | #111 | Exceptional $63,540 |
| Syrians | 93.4 /100 | #112 | Exceptional $63,494 |
| Immigrants | Serbia | 92.7 /100 | #113 | Exceptional $63,387 |
| Immigrants | Saudi Arabia | 92.4 /100 | #114 | Exceptional $63,355 |
| Croatians | 91.4 /100 | #115 | Exceptional $63,225 |
| Guamanians/Chamorros | 91.1 /100 | #116 | Exceptional $63,187 |
| Immigrants | Croatia | 90.9 /100 | #117 | Exceptional $63,168 |
| Danes | 90.5 /100 | #118 | Exceptional $63,117 |
| Immigrants | Jordan | 89.8 /100 | #119 | Excellent $63,041 |
| Ukrainians | 89.7 /100 | #120 | Excellent $63,032 |
| Immigrants | Vietnam | 89.5 /100 | #121 | Excellent $63,014 |
| Immigrants | Moldova | 88.7 /100 | #122 | Excellent $62,939 |
| Tlingit-Haida | 88.6 /100 | #123 | Excellent $62,922 |
| Taiwanese | 88.3 /100 | #124 | Excellent $62,894 |
| Soviet Union | 87.8 /100 | #125 | Excellent $62,848 |
| Peruvians | 86.8 /100 | #126 | Excellent $62,766 |