Pakistani vs Immigrants from Peru Per Capita Income
COMPARE
Pakistani
Immigrants from Peru
Per Capita Income
Per Capita Income Comparison
Pakistanis
Immigrants from Peru
$45,587
PER CAPITA INCOME
89.7/ 100
METRIC RATING
133rd/ 347
METRIC RANK
$43,852
PER CAPITA INCOME
55.3/ 100
METRIC RATING
169th/ 347
METRIC RANK
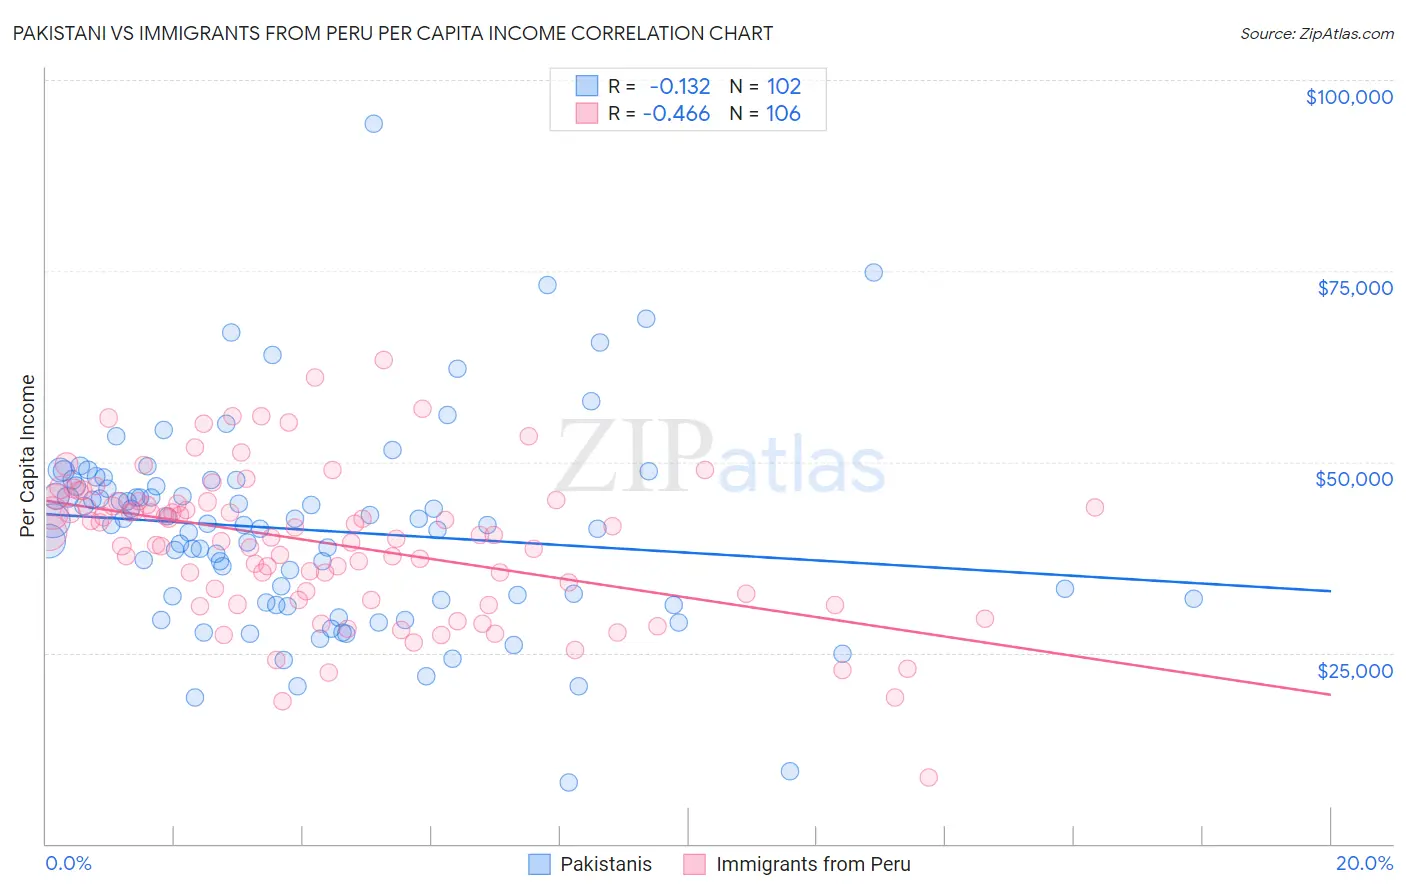
Pakistani vs Immigrants from Peru Per Capita Income Correlation Chart
The statistical analysis conducted on geographies consisting of 335,371,609 people shows a poor negative correlation between the proportion of Pakistanis and per capita income in the United States with a correlation coefficient (R) of -0.132 and weighted average of $45,587. Similarly, the statistical analysis conducted on geographies consisting of 328,865,889 people shows a moderate negative correlation between the proportion of Immigrants from Peru and per capita income in the United States with a correlation coefficient (R) of -0.466 and weighted average of $43,852, a difference of 4.0%.
Per Capita Income Correlation Summary
| Measurement | Pakistani | Immigrants from Peru |
| Minimum | $8,026 | $8,682 |
| Maximum | $94,275 | $63,347 |
| Range | $86,249 | $54,665 |
| Mean | $41,080 | $39,361 |
| Median | $41,744 | $40,406 |
| Interquartile 25% (IQ1) | $31,965 | $32,749 |
| Interquartile 75% (IQ3) | $46,855 | $44,764 |
| Interquartile Range (IQR) | $14,890 | $12,015 |
| Standard Deviation (Sample) | $13,251 | $9,599 |
| Standard Deviation (Population) | $13,186 | $9,553 |
Similar Demographics by Per Capita Income
Demographics Similar to Pakistanis by Per Capita Income
In terms of per capita income, the demographic groups most similar to Pakistanis are Slovene ($45,581, a difference of 0.010%), Jordanian ($45,605, a difference of 0.040%), Immigrants from North Macedonia ($45,622, a difference of 0.080%), Arab ($45,662, a difference of 0.16%), and Luxembourger ($45,663, a difference of 0.17%).
| Demographics | Rating | Rank | Per Capita Income |
| Palestinians | 91.6 /100 | #126 | Exceptional $45,790 |
| Immigrants | Germany | 91.3 /100 | #127 | Exceptional $45,751 |
| Swedes | 91.3 /100 | #128 | Exceptional $45,750 |
| Luxembourgers | 90.4 /100 | #129 | Exceptional $45,663 |
| Arabs | 90.4 /100 | #130 | Exceptional $45,662 |
| Immigrants | North Macedonia | 90.0 /100 | #131 | Exceptional $45,622 |
| Jordanians | 89.9 /100 | #132 | Excellent $45,605 |
| Pakistanis | 89.7 /100 | #133 | Excellent $45,587 |
| Slovenes | 89.6 /100 | #134 | Excellent $45,581 |
| Hungarians | 87.9 /100 | #135 | Excellent $45,426 |
| Immigrants | Oceania | 85.2 /100 | #136 | Excellent $45,220 |
| Immigrants | Syria | 85.2 /100 | #137 | Excellent $45,218 |
| Assyrians/Chaldeans/Syriacs | 84.8 /100 | #138 | Excellent $45,195 |
| Basques | 83.2 /100 | #139 | Excellent $45,086 |
| Immigrants | Jordan | 82.9 /100 | #140 | Excellent $45,066 |
Demographics Similar to Immigrants from Peru by Per Capita Income
In terms of per capita income, the demographic groups most similar to Immigrants from Peru are Scandinavian ($43,848, a difference of 0.010%), Immigrants from Eastern Africa ($43,838, a difference of 0.030%), Czechoslovakian ($43,806, a difference of 0.11%), Belgian ($43,951, a difference of 0.23%), and English ($43,982, a difference of 0.30%).
| Demographics | Rating | Rank | Per Capita Income |
| Swiss | 61.4 /100 | #162 | Good $44,076 |
| Immigrants | South America | 61.2 /100 | #163 | Good $44,068 |
| Sri Lankans | 59.8 /100 | #164 | Average $44,014 |
| Immigrants | Philippines | 59.4 /100 | #165 | Average $44,000 |
| Immigrants | Uruguay | 59.3 /100 | #166 | Average $43,997 |
| English | 58.9 /100 | #167 | Average $43,982 |
| Belgians | 58.1 /100 | #168 | Average $43,951 |
| Immigrants | Peru | 55.3 /100 | #169 | Average $43,852 |
| Scandinavians | 55.2 /100 | #170 | Average $43,848 |
| Immigrants | Eastern Africa | 54.9 /100 | #171 | Average $43,838 |
| Czechoslovakians | 54.1 /100 | #172 | Average $43,806 |
| French | 50.7 /100 | #173 | Average $43,685 |
| Colombians | 50.0 /100 | #174 | Average $43,661 |
| Celtics | 48.9 /100 | #175 | Average $43,621 |
| Immigrants | South Eastern Asia | 46.6 /100 | #176 | Average $43,539 |