Immigrants from Iran vs Panamanian Median Household Income
COMPARE
Immigrants from Iran
Panamanian
Median Household Income
Median Household Income Comparison
Immigrants from Iran
Panamanians
$108,055
MEDIAN HOUSEHOLD INCOME
100.0/ 100
METRIC RATING
8th/ 347
METRIC RANK
$82,272
MEDIAN HOUSEHOLD INCOME
14.0/ 100
METRIC RATING
214th/ 347
METRIC RANK
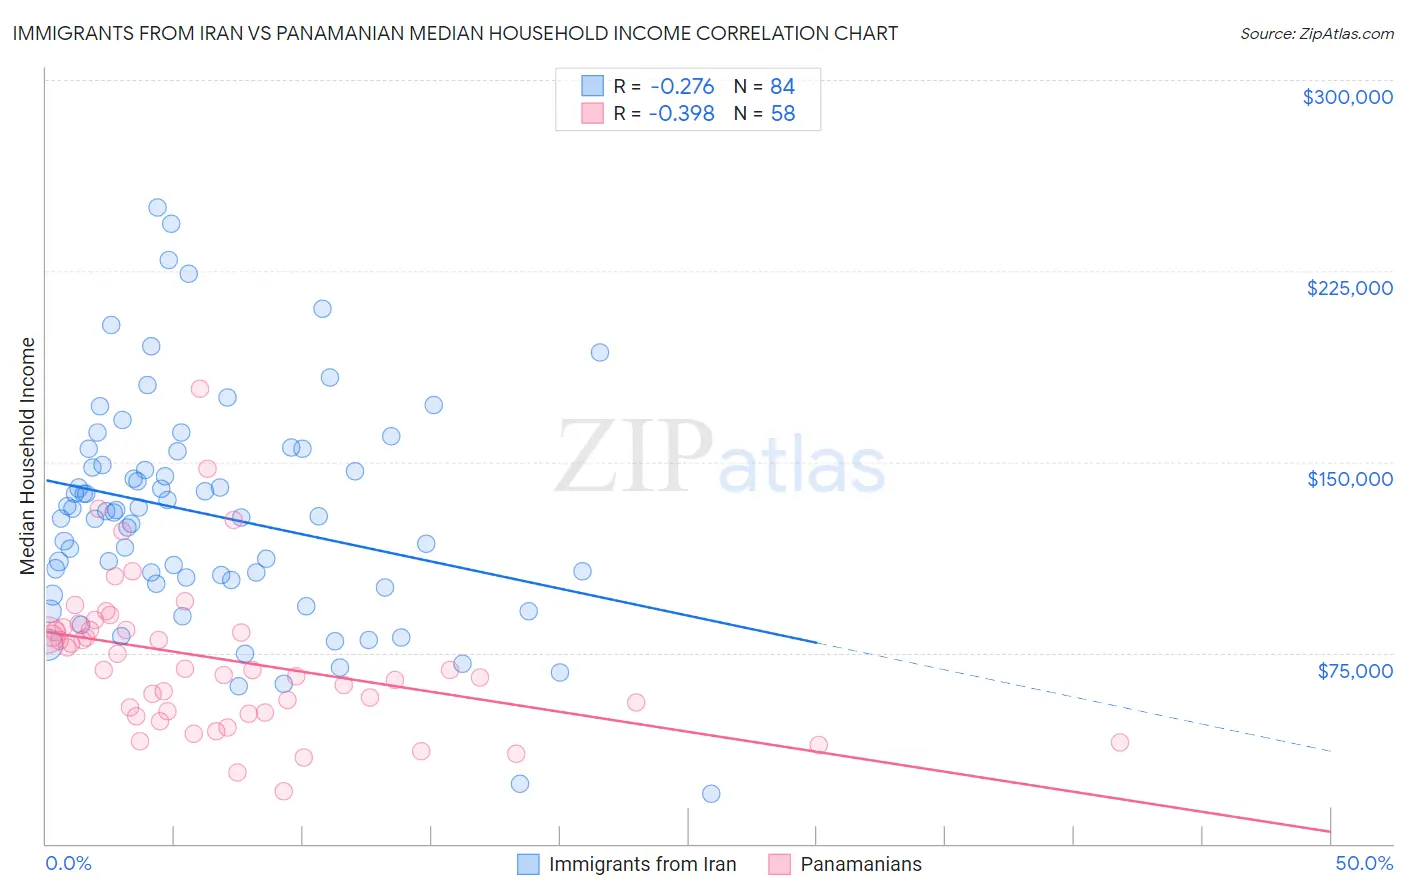
Immigrants from Iran vs Panamanian Median Household Income Correlation Chart
The statistical analysis conducted on geographies consisting of 279,821,960 people shows a weak negative correlation between the proportion of Immigrants from Iran and median household income in the United States with a correlation coefficient (R) of -0.276 and weighted average of $108,055. Similarly, the statistical analysis conducted on geographies consisting of 281,034,556 people shows a mild negative correlation between the proportion of Panamanians and median household income in the United States with a correlation coefficient (R) of -0.398 and weighted average of $82,272, a difference of 31.3%.
Median Household Income Correlation Summary
| Measurement | Immigrants from Iran | Panamanian |
| Minimum | $19,722 | $20,556 |
| Maximum | $250,001 | $178,834 |
| Range | $230,279 | $158,278 |
| Mean | $128,949 | $72,362 |
| Median | $129,200 | $68,346 |
| Interquartile 25% (IQ1) | $102,878 | $51,530 |
| Interquartile 75% (IQ3) | $151,481 | $83,972 |
| Interquartile Range (IQR) | $48,604 | $32,442 |
| Standard Deviation (Sample) | $44,216 | $29,634 |
| Standard Deviation (Population) | $43,952 | $29,377 |
Similar Demographics by Median Household Income
Demographics Similar to Immigrants from Iran by Median Household Income
In terms of median household income, the demographic groups most similar to Immigrants from Iran are Okinawan ($106,624, a difference of 1.3%), Iranian ($109,835, a difference of 1.7%), Immigrants from South Central Asia ($106,057, a difference of 1.9%), Immigrants from Singapore ($110,428, a difference of 2.2%), and Thai ($110,648, a difference of 2.4%).
| Demographics | Rating | Rank | Median Household Income |
| Immigrants | Taiwan | 100.0 /100 | #1 | Exceptional $116,460 |
| Filipinos | 100.0 /100 | #2 | Exceptional $115,509 |
| Immigrants | India | 100.0 /100 | #3 | Exceptional $113,009 |
| Immigrants | Hong Kong | 100.0 /100 | #4 | Exceptional $111,519 |
| Thais | 100.0 /100 | #5 | Exceptional $110,648 |
| Immigrants | Singapore | 100.0 /100 | #6 | Exceptional $110,428 |
| Iranians | 100.0 /100 | #7 | Exceptional $109,835 |
| Immigrants | Iran | 100.0 /100 | #8 | Exceptional $108,055 |
| Okinawans | 100.0 /100 | #9 | Exceptional $106,624 |
| Immigrants | South Central Asia | 100.0 /100 | #10 | Exceptional $106,057 |
| Immigrants | China | 100.0 /100 | #11 | Exceptional $105,335 |
| Indians (Asian) | 100.0 /100 | #12 | Exceptional $105,262 |
| Immigrants | Eastern Asia | 100.0 /100 | #13 | Exceptional $104,796 |
| Immigrants | Ireland | 100.0 /100 | #14 | Exceptional $104,692 |
| Immigrants | Israel | 100.0 /100 | #15 | Exceptional $104,090 |
Demographics Similar to Panamanians by Median Household Income
In terms of median household income, the demographic groups most similar to Panamanians are Vietnamese ($82,248, a difference of 0.030%), Yugoslavian ($82,186, a difference of 0.10%), Nepalese ($82,410, a difference of 0.17%), Venezuelan ($82,432, a difference of 0.20%), and Salvadoran ($82,449, a difference of 0.22%).
| Demographics | Rating | Rank | Median Household Income |
| Dutch | 20.3 /100 | #207 | Fair $82,971 |
| French Canadians | 18.7 /100 | #208 | Poor $82,810 |
| Immigrants | Iraq | 16.7 /100 | #209 | Poor $82,594 |
| Immigrants | Uruguay | 16.4 /100 | #210 | Poor $82,560 |
| Salvadorans | 15.4 /100 | #211 | Poor $82,449 |
| Venezuelans | 15.3 /100 | #212 | Poor $82,432 |
| Nepalese | 15.1 /100 | #213 | Poor $82,410 |
| Panamanians | 14.0 /100 | #214 | Poor $82,272 |
| Vietnamese | 13.8 /100 | #215 | Poor $82,248 |
| Yugoslavians | 13.3 /100 | #216 | Poor $82,186 |
| Ecuadorians | 12.5 /100 | #217 | Poor $82,070 |
| Whites/Caucasians | 12.2 /100 | #218 | Poor $82,029 |
| Nigerians | 10.3 /100 | #219 | Poor $81,725 |
| Immigrants | Venezuela | 9.0 /100 | #220 | Tragic $81,506 |
| Immigrants | Ghana | 9.0 /100 | #221 | Tragic $81,489 |