Paiute vs Bulgarian Median Male Earnings
COMPARE
Paiute
Bulgarian
Median Male Earnings
Median Male Earnings Comparison
Paiute
Bulgarians
$47,991
MEDIAN MALE EARNINGS
0.2/ 100
METRIC RATING
285th/ 347
METRIC RANK
$62,378
MEDIAN MALE EARNINGS
100.0/ 100
METRIC RATING
45th/ 347
METRIC RANK
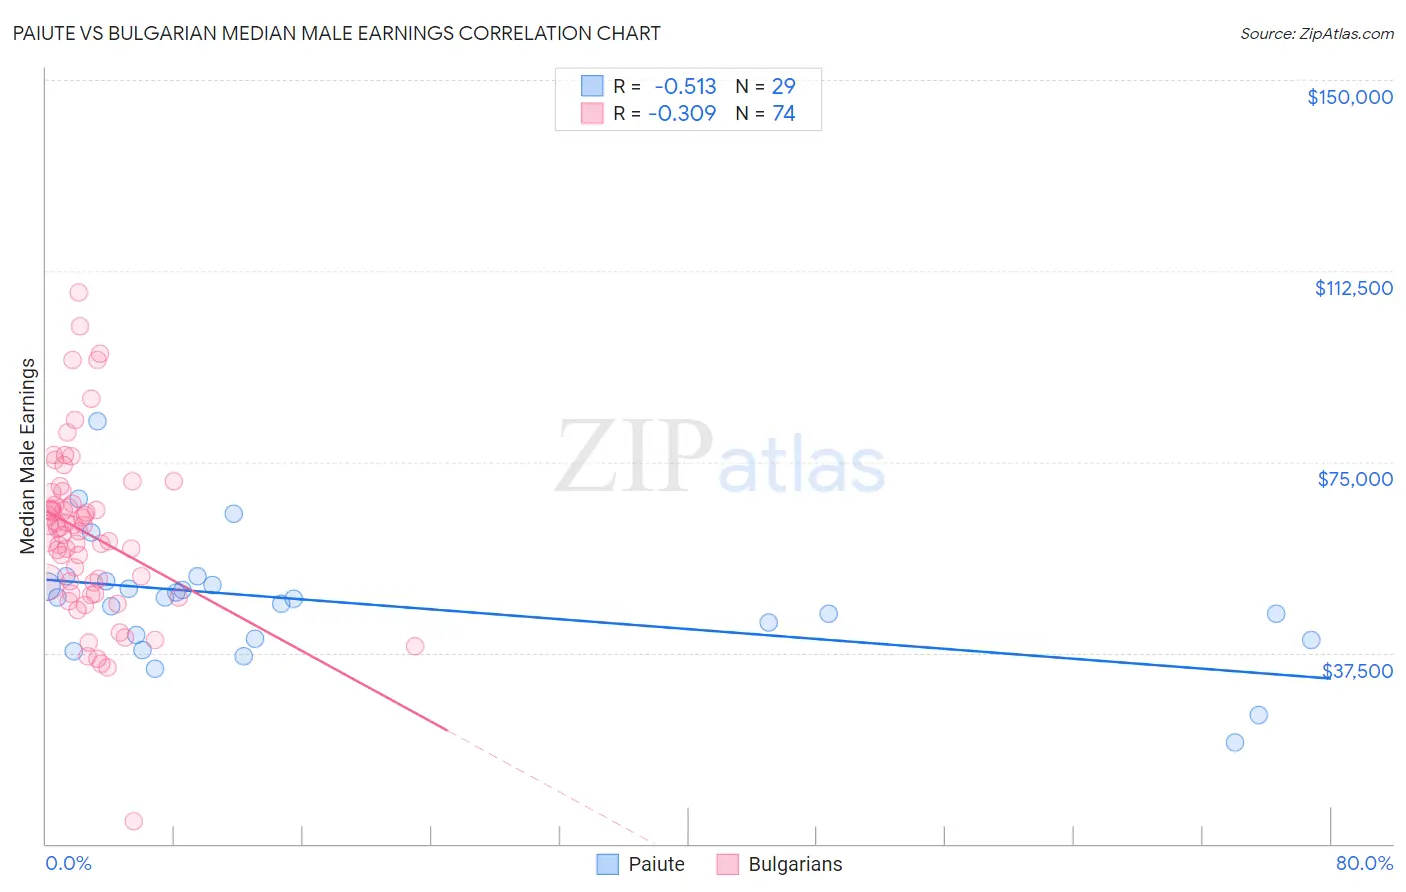
Paiute vs Bulgarian Median Male Earnings Correlation Chart
The statistical analysis conducted on geographies consisting of 58,389,146 people shows a substantial negative correlation between the proportion of Paiute and median male earnings in the United States with a correlation coefficient (R) of -0.513 and weighted average of $47,991. Similarly, the statistical analysis conducted on geographies consisting of 205,598,511 people shows a mild negative correlation between the proportion of Bulgarians and median male earnings in the United States with a correlation coefficient (R) of -0.309 and weighted average of $62,378, a difference of 30.0%.
Median Male Earnings Correlation Summary
| Measurement | Paiute | Bulgarian |
| Minimum | $19,917 | $4,447 |
| Maximum | $82,917 | $108,199 |
| Range | $63,000 | $103,752 |
| Mean | $47,248 | $60,992 |
| Median | $48,199 | $62,011 |
| Interquartile 25% (IQ1) | $40,132 | $51,254 |
| Interquartile 75% (IQ3) | $51,150 | $66,727 |
| Interquartile Range (IQR) | $11,018 | $15,473 |
| Standard Deviation (Sample) | $12,204 | $16,836 |
| Standard Deviation (Population) | $11,992 | $16,722 |
Similar Demographics by Median Male Earnings
Demographics Similar to Paiute by Median Male Earnings
In terms of median male earnings, the demographic groups most similar to Paiute are Mexican American Indian ($47,990, a difference of 0.0%), African ($47,994, a difference of 0.010%), Immigrants from El Salvador ($47,973, a difference of 0.040%), Immigrants from Jamaica ($48,040, a difference of 0.10%), and Shoshone ($47,930, a difference of 0.13%).
| Demographics | Rating | Rank | Median Male Earnings |
| Immigrants | Liberia | 0.2 /100 | #278 | Tragic $48,317 |
| Hmong | 0.2 /100 | #279 | Tragic $48,254 |
| Comanche | 0.2 /100 | #280 | Tragic $48,202 |
| Marshallese | 0.2 /100 | #281 | Tragic $48,137 |
| Central Americans | 0.2 /100 | #282 | Tragic $48,093 |
| Immigrants | Jamaica | 0.2 /100 | #283 | Tragic $48,040 |
| Africans | 0.2 /100 | #284 | Tragic $47,994 |
| Paiute | 0.2 /100 | #285 | Tragic $47,991 |
| Mexican American Indians | 0.2 /100 | #286 | Tragic $47,990 |
| Immigrants | El Salvador | 0.2 /100 | #287 | Tragic $47,973 |
| Shoshone | 0.2 /100 | #288 | Tragic $47,930 |
| Chickasaw | 0.1 /100 | #289 | Tragic $47,832 |
| Immigrants | Belize | 0.1 /100 | #290 | Tragic $47,809 |
| Choctaw | 0.1 /100 | #291 | Tragic $47,729 |
| Immigrants | Dominica | 0.1 /100 | #292 | Tragic $47,651 |
Demographics Similar to Bulgarians by Median Male Earnings
In terms of median male earnings, the demographic groups most similar to Bulgarians are Cambodian ($62,516, a difference of 0.22%), Immigrants from Czechoslovakia ($62,217, a difference of 0.26%), Immigrants from Austria ($62,164, a difference of 0.35%), Immigrants from Malaysia ($62,121, a difference of 0.41%), and Immigrants from Belarus ($62,658, a difference of 0.45%).
| Demographics | Rating | Rank | Median Male Earnings |
| Maltese | 100.0 /100 | #38 | Exceptional $62,953 |
| Immigrants | South Africa | 100.0 /100 | #39 | Exceptional $62,899 |
| Australians | 100.0 /100 | #40 | Exceptional $62,857 |
| Immigrants | Turkey | 100.0 /100 | #41 | Exceptional $62,728 |
| Immigrants | Greece | 100.0 /100 | #42 | Exceptional $62,689 |
| Immigrants | Belarus | 100.0 /100 | #43 | Exceptional $62,658 |
| Cambodians | 100.0 /100 | #44 | Exceptional $62,516 |
| Bulgarians | 100.0 /100 | #45 | Exceptional $62,378 |
| Immigrants | Czechoslovakia | 99.9 /100 | #46 | Exceptional $62,217 |
| Immigrants | Austria | 99.9 /100 | #47 | Exceptional $62,164 |
| Immigrants | Malaysia | 99.9 /100 | #48 | Exceptional $62,121 |
| Immigrants | Europe | 99.9 /100 | #49 | Exceptional $62,057 |
| Bhutanese | 99.9 /100 | #50 | Exceptional $61,759 |
| Estonians | 99.9 /100 | #51 | Exceptional $61,710 |
| Immigrants | Norway | 99.9 /100 | #52 | Exceptional $61,628 |