Paiute vs Guatemalan Median Male Earnings
COMPARE
Paiute
Guatemalan
Median Male Earnings
Median Male Earnings Comparison
Paiute
Guatemalans
$47,991
MEDIAN MALE EARNINGS
0.2/ 100
METRIC RATING
285th/ 347
METRIC RANK
$46,736
MEDIAN MALE EARNINGS
0.0/ 100
METRIC RATING
305th/ 347
METRIC RANK
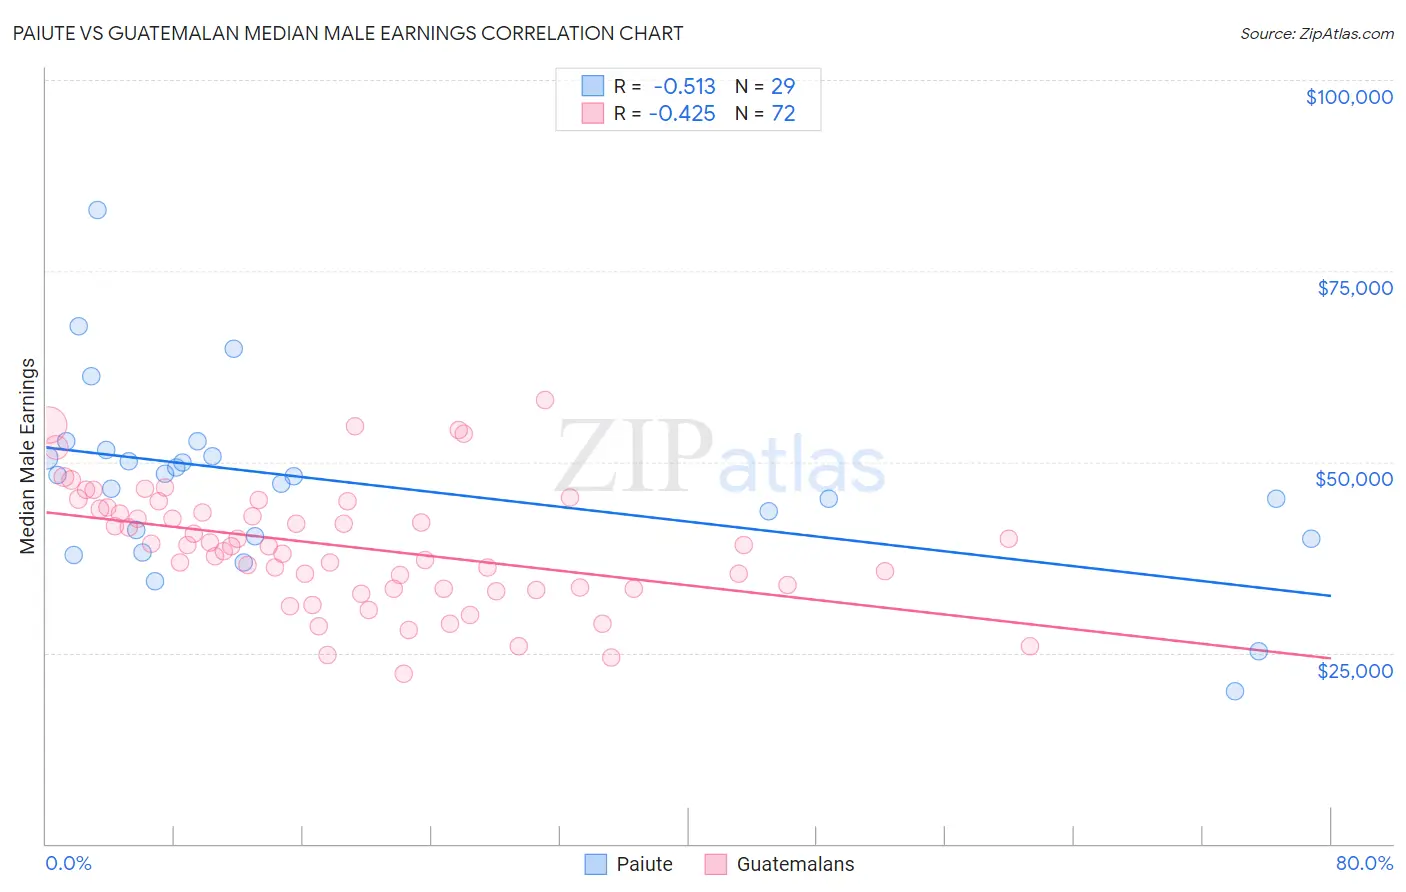
Paiute vs Guatemalan Median Male Earnings Correlation Chart
The statistical analysis conducted on geographies consisting of 58,389,146 people shows a substantial negative correlation between the proportion of Paiute and median male earnings in the United States with a correlation coefficient (R) of -0.513 and weighted average of $47,991. Similarly, the statistical analysis conducted on geographies consisting of 409,446,207 people shows a moderate negative correlation between the proportion of Guatemalans and median male earnings in the United States with a correlation coefficient (R) of -0.425 and weighted average of $46,736, a difference of 2.7%.
Median Male Earnings Correlation Summary
| Measurement | Paiute | Guatemalan |
| Minimum | $19,917 | $22,332 |
| Maximum | $82,917 | $58,162 |
| Range | $63,000 | $35,830 |
| Mean | $47,248 | $38,925 |
| Median | $48,199 | $39,033 |
| Interquartile 25% (IQ1) | $40,132 | $33,424 |
| Interquartile 75% (IQ3) | $51,150 | $43,885 |
| Interquartile Range (IQR) | $11,018 | $10,461 |
| Standard Deviation (Sample) | $12,204 | $7,785 |
| Standard Deviation (Population) | $11,992 | $7,731 |
Demographics Similar to Paiute and Guatemalans by Median Male Earnings
In terms of median male earnings, the demographic groups most similar to Paiute are Mexican American Indian ($47,990, a difference of 0.0%), Immigrants from El Salvador ($47,973, a difference of 0.040%), Shoshone ($47,930, a difference of 0.13%), Chickasaw ($47,832, a difference of 0.33%), and Immigrants from Belize ($47,809, a difference of 0.38%). Similarly, the demographic groups most similar to Guatemalans are Bangladeshi ($46,744, a difference of 0.020%), Yaqui ($46,777, a difference of 0.090%), Seminole ($46,783, a difference of 0.10%), Immigrants from Latin America ($46,941, a difference of 0.44%), and Immigrants from Zaire ($47,070, a difference of 0.71%).
| Demographics | Rating | Rank | Median Male Earnings |
| Paiute | 0.2 /100 | #285 | Tragic $47,991 |
| Mexican American Indians | 0.2 /100 | #286 | Tragic $47,990 |
| Immigrants | El Salvador | 0.2 /100 | #287 | Tragic $47,973 |
| Shoshone | 0.2 /100 | #288 | Tragic $47,930 |
| Chickasaw | 0.1 /100 | #289 | Tragic $47,832 |
| Immigrants | Belize | 0.1 /100 | #290 | Tragic $47,809 |
| Choctaw | 0.1 /100 | #291 | Tragic $47,729 |
| Immigrants | Dominica | 0.1 /100 | #292 | Tragic $47,651 |
| Indonesians | 0.1 /100 | #293 | Tragic $47,503 |
| Immigrants | Nicaragua | 0.1 /100 | #294 | Tragic $47,482 |
| Central American Indians | 0.1 /100 | #295 | Tragic $47,433 |
| Inupiat | 0.1 /100 | #296 | Tragic $47,281 |
| Dominicans | 0.1 /100 | #297 | Tragic $47,204 |
| Immigrants | Micronesia | 0.1 /100 | #298 | Tragic $47,177 |
| Immigrants | Zaire | 0.1 /100 | #299 | Tragic $47,070 |
| U.S. Virgin Islanders | 0.1 /100 | #300 | Tragic $47,066 |
| Immigrants | Latin America | 0.1 /100 | #301 | Tragic $46,941 |
| Seminole | 0.1 /100 | #302 | Tragic $46,783 |
| Yaqui | 0.1 /100 | #303 | Tragic $46,777 |
| Bangladeshis | 0.1 /100 | #304 | Tragic $46,744 |
| Guatemalans | 0.0 /100 | #305 | Tragic $46,736 |