Puerto Rican vs Kiowa Median Male Earnings
COMPARE
Puerto Rican
Kiowa
Median Male Earnings
Median Male Earnings Comparison
Puerto Ricans
Kiowa
$40,071
MEDIAN MALE EARNINGS
0.0/ 100
METRIC RATING
345th/ 347
METRIC RANK
$45,094
MEDIAN MALE EARNINGS
0.0/ 100
METRIC RATING
328th/ 347
METRIC RANK
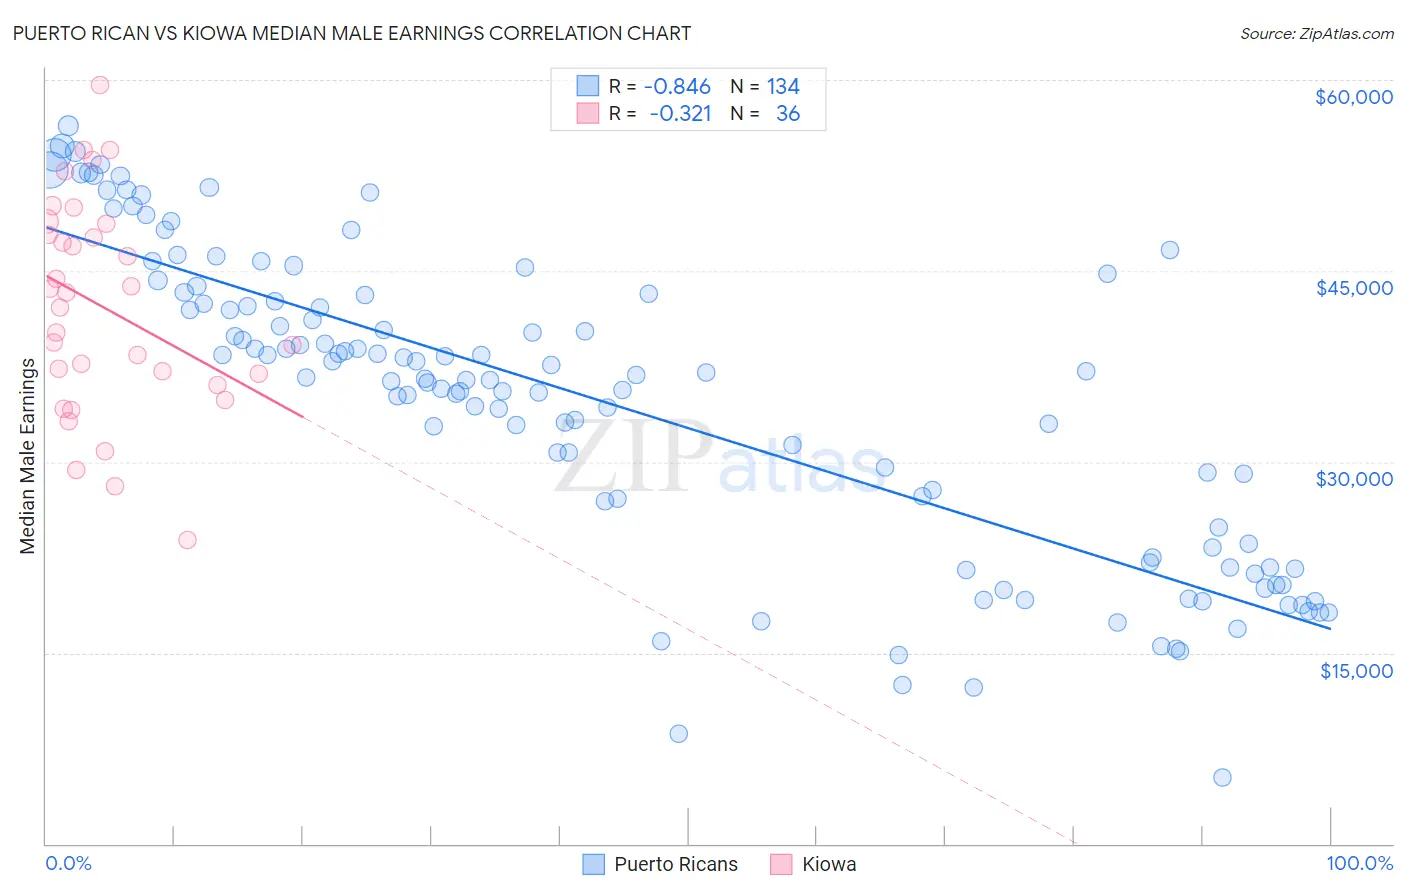
Puerto Rican vs Kiowa Median Male Earnings Correlation Chart
The statistical analysis conducted on geographies consisting of 527,834,370 people shows a very strong negative correlation between the proportion of Puerto Ricans and median male earnings in the United States with a correlation coefficient (R) of -0.846 and weighted average of $40,071. Similarly, the statistical analysis conducted on geographies consisting of 56,097,810 people shows a mild negative correlation between the proportion of Kiowa and median male earnings in the United States with a correlation coefficient (R) of -0.321 and weighted average of $45,094, a difference of 12.5%.
Median Male Earnings Correlation Summary
| Measurement | Puerto Rican | Kiowa |
| Minimum | $5,183 | $23,854 |
| Maximum | $56,414 | $59,583 |
| Range | $51,231 | $35,729 |
| Mean | $34,723 | $42,136 |
| Median | $36,571 | $42,718 |
| Interquartile 25% (IQ1) | $23,294 | $36,490 |
| Interquartile 75% (IQ3) | $43,124 | $48,295 |
| Interquartile Range (IQR) | $19,830 | $11,805 |
| Standard Deviation (Sample) | $11,965 | $8,380 |
| Standard Deviation (Population) | $11,920 | $8,263 |
Demographics Similar to Puerto Ricans and Kiowa by Median Male Earnings
In terms of median male earnings, the demographic groups most similar to Puerto Ricans are Tohono O'odham ($39,543, a difference of 1.3%), Pueblo ($41,314, a difference of 3.1%), Lumbee ($41,715, a difference of 4.1%), Arapaho ($41,758, a difference of 4.2%), and Hopi ($42,060, a difference of 5.0%). Similarly, the demographic groups most similar to Kiowa are Immigrants from Bahamas ($45,176, a difference of 0.18%), Yakama ($45,002, a difference of 0.20%), Immigrants from Mexico ($44,960, a difference of 0.30%), Immigrants from Haiti ($45,266, a difference of 0.38%), and Native/Alaskan ($44,775, a difference of 0.71%).
| Demographics | Rating | Rank | Median Male Earnings |
| Immigrants | Haiti | 0.0 /100 | #326 | Tragic $45,266 |
| Immigrants | Bahamas | 0.0 /100 | #327 | Tragic $45,176 |
| Kiowa | 0.0 /100 | #328 | Tragic $45,094 |
| Yakama | 0.0 /100 | #329 | Tragic $45,002 |
| Immigrants | Mexico | 0.0 /100 | #330 | Tragic $44,960 |
| Natives/Alaskans | 0.0 /100 | #331 | Tragic $44,775 |
| Bahamians | 0.0 /100 | #332 | Tragic $44,756 |
| Immigrants | Congo | 0.0 /100 | #333 | Tragic $44,204 |
| Immigrants | Yemen | 0.0 /100 | #334 | Tragic $44,083 |
| Spanish American Indians | 0.0 /100 | #335 | Tragic $44,010 |
| Immigrants | Cuba | 0.0 /100 | #336 | Tragic $43,461 |
| Menominee | 0.0 /100 | #337 | Tragic $42,581 |
| Crow | 0.0 /100 | #338 | Tragic $42,434 |
| Pima | 0.0 /100 | #339 | Tragic $42,357 |
| Navajo | 0.0 /100 | #340 | Tragic $42,098 |
| Hopi | 0.0 /100 | #341 | Tragic $42,060 |
| Arapaho | 0.0 /100 | #342 | Tragic $41,758 |
| Lumbee | 0.0 /100 | #343 | Tragic $41,715 |
| Pueblo | 0.0 /100 | #344 | Tragic $41,314 |
| Puerto Ricans | 0.0 /100 | #345 | Tragic $40,071 |
| Tohono O'odham | 0.0 /100 | #346 | Tragic $39,543 |