Indonesian vs Kiowa Median Male Earnings
COMPARE
Indonesian
Kiowa
Median Male Earnings
Median Male Earnings Comparison
Indonesians
Kiowa
$47,503
MEDIAN MALE EARNINGS
0.1/ 100
METRIC RATING
293rd/ 347
METRIC RANK
$45,094
MEDIAN MALE EARNINGS
0.0/ 100
METRIC RATING
328th/ 347
METRIC RANK
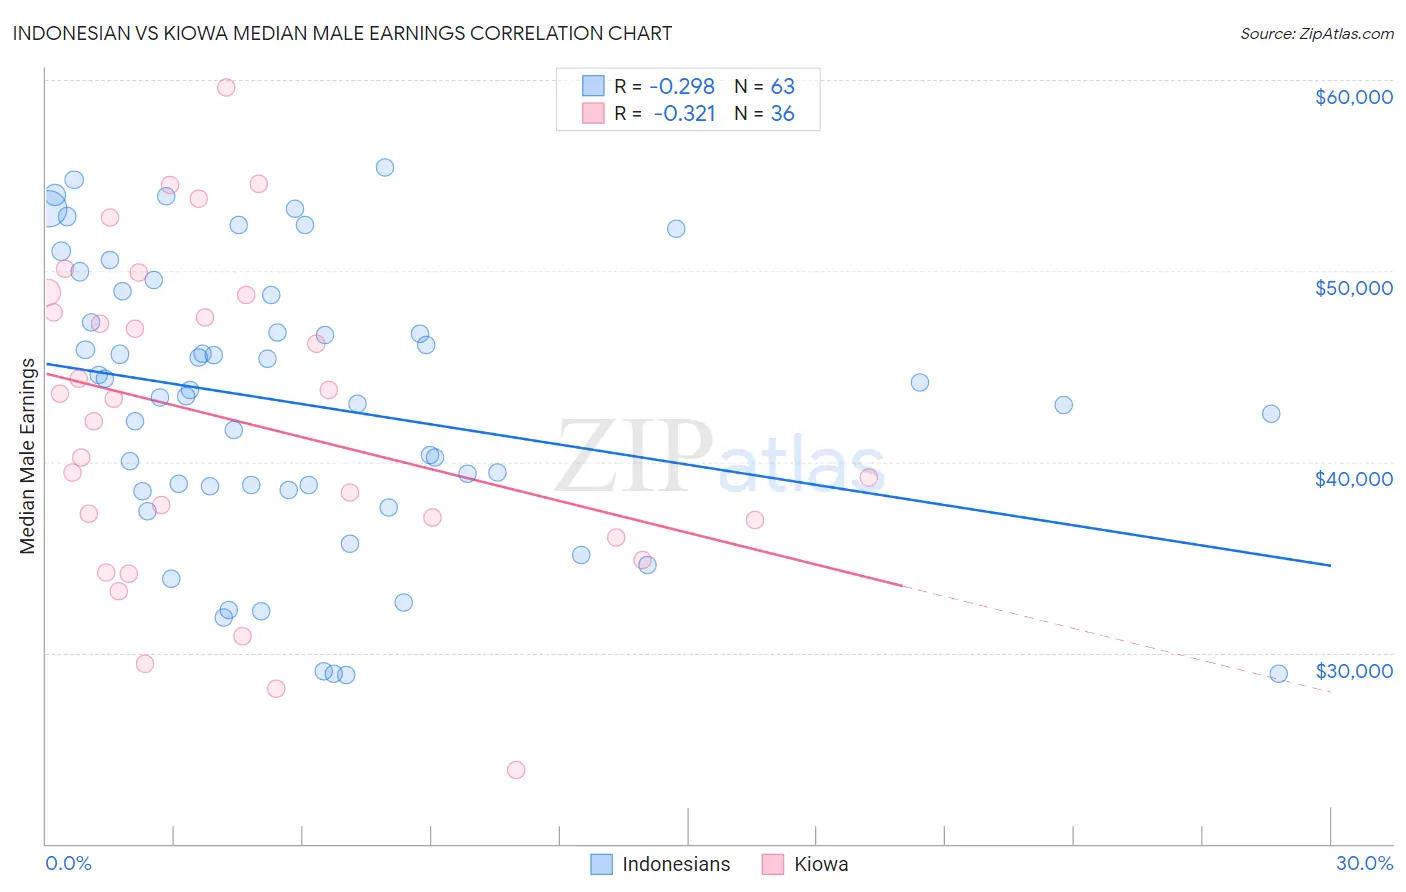
Indonesian vs Kiowa Median Male Earnings Correlation Chart
The statistical analysis conducted on geographies consisting of 162,701,910 people shows a weak negative correlation between the proportion of Indonesians and median male earnings in the United States with a correlation coefficient (R) of -0.298 and weighted average of $47,503. Similarly, the statistical analysis conducted on geographies consisting of 56,097,810 people shows a mild negative correlation between the proportion of Kiowa and median male earnings in the United States with a correlation coefficient (R) of -0.321 and weighted average of $45,094, a difference of 5.3%.
Median Male Earnings Correlation Summary
| Measurement | Indonesian | Kiowa |
| Minimum | $28,857 | $23,854 |
| Maximum | $55,385 | $59,583 |
| Range | $26,528 | $35,729 |
| Mean | $42,970 | $42,136 |
| Median | $43,436 | $42,718 |
| Interquartile 25% (IQ1) | $38,534 | $36,490 |
| Interquartile 75% (IQ3) | $48,720 | $48,295 |
| Interquartile Range (IQR) | $10,186 | $11,805 |
| Standard Deviation (Sample) | $7,238 | $8,380 |
| Standard Deviation (Population) | $7,181 | $8,263 |
Similar Demographics by Median Male Earnings
Demographics Similar to Indonesians by Median Male Earnings
In terms of median male earnings, the demographic groups most similar to Indonesians are Immigrants from Nicaragua ($47,482, a difference of 0.040%), Central American Indian ($47,433, a difference of 0.15%), Immigrants from Dominica ($47,651, a difference of 0.31%), Inupiat ($47,281, a difference of 0.47%), and Choctaw ($47,729, a difference of 0.48%).
| Demographics | Rating | Rank | Median Male Earnings |
| Mexican American Indians | 0.2 /100 | #286 | Tragic $47,990 |
| Immigrants | El Salvador | 0.2 /100 | #287 | Tragic $47,973 |
| Shoshone | 0.2 /100 | #288 | Tragic $47,930 |
| Chickasaw | 0.1 /100 | #289 | Tragic $47,832 |
| Immigrants | Belize | 0.1 /100 | #290 | Tragic $47,809 |
| Choctaw | 0.1 /100 | #291 | Tragic $47,729 |
| Immigrants | Dominica | 0.1 /100 | #292 | Tragic $47,651 |
| Indonesians | 0.1 /100 | #293 | Tragic $47,503 |
| Immigrants | Nicaragua | 0.1 /100 | #294 | Tragic $47,482 |
| Central American Indians | 0.1 /100 | #295 | Tragic $47,433 |
| Inupiat | 0.1 /100 | #296 | Tragic $47,281 |
| Dominicans | 0.1 /100 | #297 | Tragic $47,204 |
| Immigrants | Micronesia | 0.1 /100 | #298 | Tragic $47,177 |
| Immigrants | Zaire | 0.1 /100 | #299 | Tragic $47,070 |
| U.S. Virgin Islanders | 0.1 /100 | #300 | Tragic $47,066 |
Demographics Similar to Kiowa by Median Male Earnings
In terms of median male earnings, the demographic groups most similar to Kiowa are Immigrants from Bahamas ($45,176, a difference of 0.18%), Yakama ($45,002, a difference of 0.20%), Immigrants from Mexico ($44,960, a difference of 0.30%), Immigrants from Haiti ($45,266, a difference of 0.38%), and Native/Alaskan ($44,775, a difference of 0.71%).
| Demographics | Rating | Rank | Median Male Earnings |
| Fijians | 0.0 /100 | #321 | Tragic $45,607 |
| Sioux | 0.0 /100 | #322 | Tragic $45,566 |
| Immigrants | Central America | 0.0 /100 | #323 | Tragic $45,538 |
| Blacks/African Americans | 0.0 /100 | #324 | Tragic $45,523 |
| Yuman | 0.0 /100 | #325 | Tragic $45,446 |
| Immigrants | Haiti | 0.0 /100 | #326 | Tragic $45,266 |
| Immigrants | Bahamas | 0.0 /100 | #327 | Tragic $45,176 |
| Kiowa | 0.0 /100 | #328 | Tragic $45,094 |
| Yakama | 0.0 /100 | #329 | Tragic $45,002 |
| Immigrants | Mexico | 0.0 /100 | #330 | Tragic $44,960 |
| Natives/Alaskans | 0.0 /100 | #331 | Tragic $44,775 |
| Bahamians | 0.0 /100 | #332 | Tragic $44,756 |
| Immigrants | Congo | 0.0 /100 | #333 | Tragic $44,204 |
| Immigrants | Yemen | 0.0 /100 | #334 | Tragic $44,083 |
| Spanish American Indians | 0.0 /100 | #335 | Tragic $44,010 |