Okinawan vs Immigrants from Moldova Associate's Degree
COMPARE
Okinawan
Immigrants from Moldova
Associate's Degree
Associate's Degree Comparison
Okinawans
Immigrants from Moldova
57.7%
ASSOCIATE'S DEGREE
100.0/ 100
METRIC RATING
6th/ 347
METRIC RANK
50.2%
ASSOCIATE'S DEGREE
98.8/ 100
METRIC RATING
87th/ 347
METRIC RANK
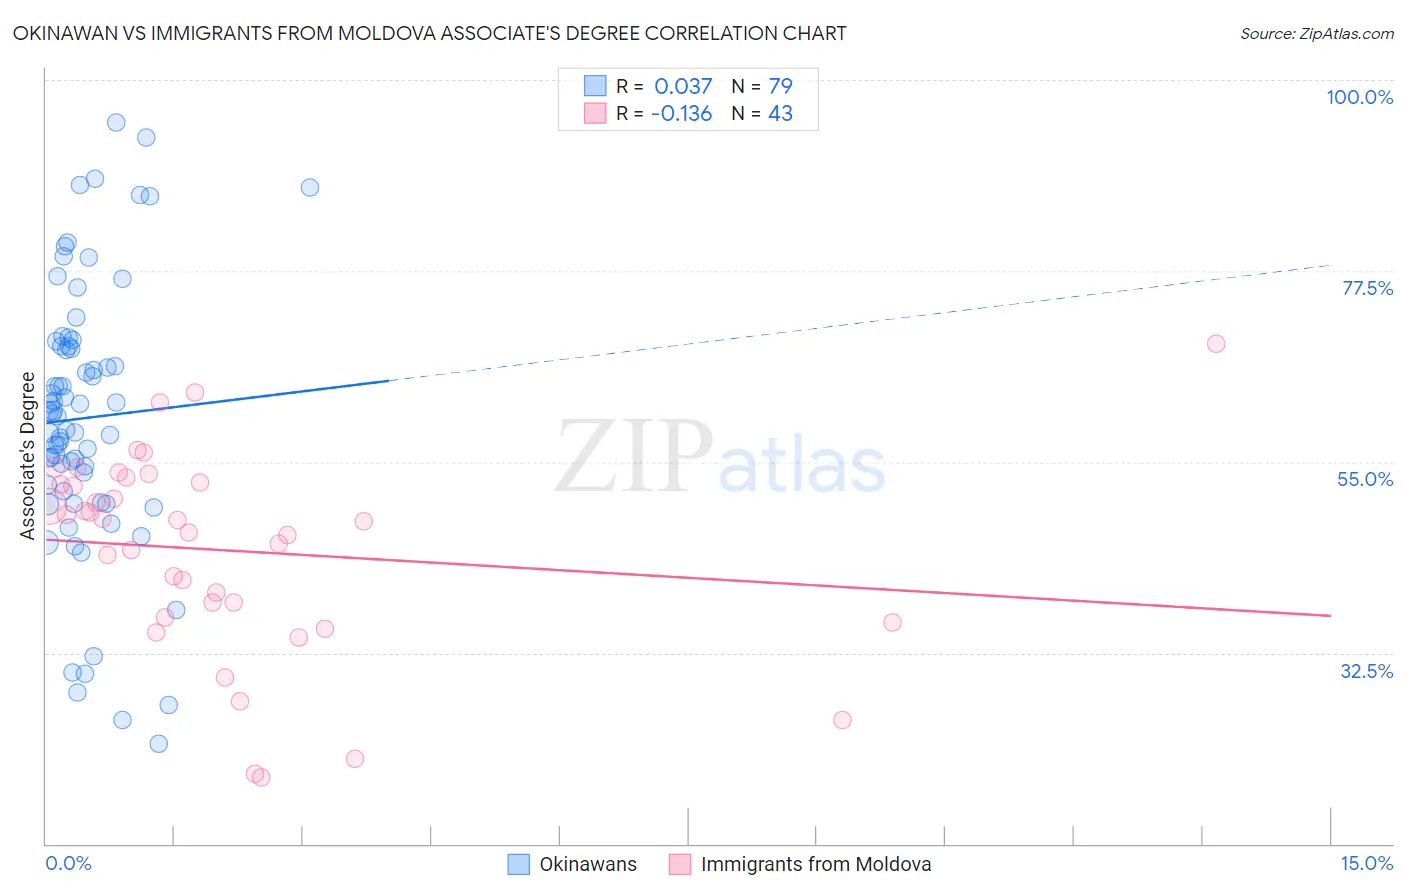
Okinawan vs Immigrants from Moldova Associate's Degree Correlation Chart
The statistical analysis conducted on geographies consisting of 73,779,368 people shows no correlation between the proportion of Okinawans and percentage of population with at least associate's degree education in the United States with a correlation coefficient (R) of 0.037 and weighted average of 57.7%. Similarly, the statistical analysis conducted on geographies consisting of 124,396,308 people shows a poor negative correlation between the proportion of Immigrants from Moldova and percentage of population with at least associate's degree education in the United States with a correlation coefficient (R) of -0.136 and weighted average of 50.2%, a difference of 15.0%.
Associate's Degree Correlation Summary
| Measurement | Okinawan | Immigrants from Moldova |
| Minimum | 21.7% | 17.8% |
| Maximum | 95.0% | 68.9% |
| Range | 73.3% | 51.1% |
| Mean | 60.2% | 44.5% |
| Median | 60.7% | 48.0% |
| Interquartile 25% (IQ1) | 51.5% | 36.7% |
| Interquartile 75% (IQ3) | 68.7% | 52.6% |
| Interquartile Range (IQR) | 17.1% | 15.8% |
| Standard Deviation (Sample) | 15.8% | 11.8% |
| Standard Deviation (Population) | 15.7% | 11.6% |
Similar Demographics by Associate's Degree
Demographics Similar to Okinawans by Associate's Degree
In terms of associate's degree, the demographic groups most similar to Okinawans are Immigrants from Iran (57.7%, a difference of 0.060%), Thai (57.4%, a difference of 0.46%), Iranian (58.2%, a difference of 0.83%), Immigrants from Taiwan (58.4%, a difference of 1.2%), and Immigrants from India (58.5%, a difference of 1.5%).
| Demographics | Rating | Rank | Associate's Degree |
| Filipinos | 100.0 /100 | #1 | Exceptional 59.8% |
| Immigrants | Singapore | 100.0 /100 | #2 | Exceptional 58.9% |
| Immigrants | India | 100.0 /100 | #3 | Exceptional 58.5% |
| Immigrants | Taiwan | 100.0 /100 | #4 | Exceptional 58.4% |
| Iranians | 100.0 /100 | #5 | Exceptional 58.2% |
| Okinawans | 100.0 /100 | #6 | Exceptional 57.7% |
| Immigrants | Iran | 100.0 /100 | #7 | Exceptional 57.7% |
| Thais | 100.0 /100 | #8 | Exceptional 57.4% |
| Immigrants | Israel | 100.0 /100 | #9 | Exceptional 56.8% |
| Cypriots | 100.0 /100 | #10 | Exceptional 56.4% |
| Immigrants | Australia | 100.0 /100 | #11 | Exceptional 55.8% |
| Immigrants | South Central Asia | 100.0 /100 | #12 | Exceptional 55.7% |
| Immigrants | China | 100.0 /100 | #13 | Exceptional 55.5% |
| Immigrants | Hong Kong | 100.0 /100 | #14 | Exceptional 55.4% |
| Immigrants | Eastern Asia | 100.0 /100 | #15 | Exceptional 55.4% |
Demographics Similar to Immigrants from Moldova by Associate's Degree
In terms of associate's degree, the demographic groups most similar to Immigrants from Moldova are Immigrants from Canada (50.1%, a difference of 0.070%), Immigrants from Western Europe (50.1%, a difference of 0.080%), Immigrants from Ethiopia (50.1%, a difference of 0.080%), Immigrants from Croatia (50.2%, a difference of 0.12%), and Immigrants from Egypt (50.2%, a difference of 0.13%).
| Demographics | Rating | Rank | Associate's Degree |
| Armenians | 99.1 /100 | #80 | Exceptional 50.4% |
| Maltese | 99.1 /100 | #81 | Exceptional 50.4% |
| Greeks | 98.9 /100 | #82 | Exceptional 50.3% |
| Immigrants | Uzbekistan | 98.9 /100 | #83 | Exceptional 50.3% |
| Immigrants | Hungary | 98.9 /100 | #84 | Exceptional 50.2% |
| Immigrants | Egypt | 98.9 /100 | #85 | Exceptional 50.2% |
| Immigrants | Croatia | 98.9 /100 | #86 | Exceptional 50.2% |
| Immigrants | Moldova | 98.8 /100 | #87 | Exceptional 50.2% |
| Immigrants | Canada | 98.7 /100 | #88 | Exceptional 50.1% |
| Immigrants | Western Europe | 98.7 /100 | #89 | Exceptional 50.1% |
| Immigrants | Ethiopia | 98.7 /100 | #90 | Exceptional 50.1% |
| Immigrants | Western Asia | 98.7 /100 | #91 | Exceptional 50.1% |
| Immigrants | North America | 98.7 /100 | #92 | Exceptional 50.1% |
| Immigrants | Brazil | 98.5 /100 | #93 | Exceptional 50.0% |
| Laotians | 98.4 /100 | #94 | Exceptional 49.9% |