Okinawan vs Basque Householder Income Ages 25 - 44 years
COMPARE
Okinawan
Basque
Householder Income Ages 25 - 44 years
Householder Income Ages 25 - 44 years Comparison
Okinawans
Basques
$119,349
HOUSEHOLDER INCOME AGES 25 - 44 YEARS
100.0/ 100
METRIC RATING
11th/ 347
METRIC RANK
$96,709
HOUSEHOLDER INCOME AGES 25 - 44 YEARS
76.6/ 100
METRIC RATING
149th/ 347
METRIC RANK
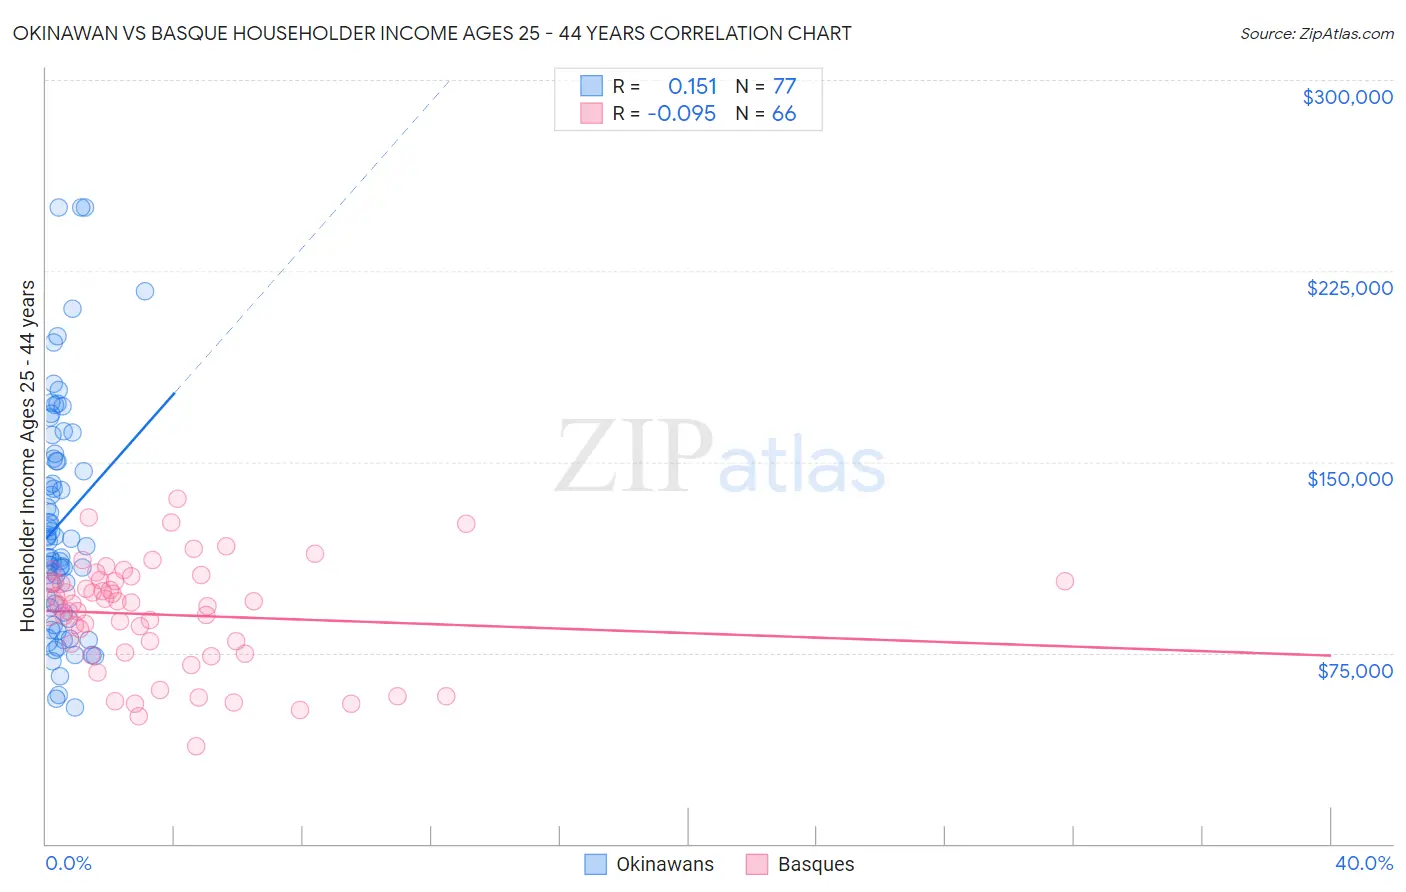
Okinawan vs Basque Householder Income Ages 25 - 44 years Correlation Chart
The statistical analysis conducted on geographies consisting of 73,689,702 people shows a poor positive correlation between the proportion of Okinawans and household income with householder between the ages 25 and 44 in the United States with a correlation coefficient (R) of 0.151 and weighted average of $119,349. Similarly, the statistical analysis conducted on geographies consisting of 165,637,052 people shows a slight negative correlation between the proportion of Basques and household income with householder between the ages 25 and 44 in the United States with a correlation coefficient (R) of -0.095 and weighted average of $96,709, a difference of 23.4%.
Householder Income Ages 25 - 44 years Correlation Summary
| Measurement | Okinawan | Basque |
| Minimum | $53,516 | $38,438 |
| Maximum | $250,001 | $135,625 |
| Range | $196,485 | $97,187 |
| Mean | $126,213 | $89,960 |
| Median | $118,882 | $93,797 |
| Interquartile 25% (IQ1) | $91,836 | $75,288 |
| Interquartile 75% (IQ3) | $152,291 | $103,321 |
| Interquartile Range (IQR) | $60,455 | $28,033 |
| Standard Deviation (Sample) | $45,314 | $21,216 |
| Standard Deviation (Population) | $45,019 | $21,055 |
Similar Demographics by Householder Income Ages 25 - 44 years
Demographics Similar to Okinawans by Householder Income Ages 25 - 44 years
In terms of householder income ages 25 - 44 years, the demographic groups most similar to Okinawans are Indian (Asian) ($119,496, a difference of 0.12%), Immigrants from Iran ($119,204, a difference of 0.12%), Immigrants from China ($119,756, a difference of 0.34%), Iranian ($120,292, a difference of 0.79%), and Immigrants from Ireland ($120,333, a difference of 0.82%).
| Demographics | Rating | Rank | Householder Income Ages 25 - 44 years |
| Immigrants | Singapore | 100.0 /100 | #4 | Exceptional $124,429 |
| Immigrants | India | 100.0 /100 | #5 | Exceptional $124,238 |
| Thais | 100.0 /100 | #6 | Exceptional $121,778 |
| Immigrants | Ireland | 100.0 /100 | #7 | Exceptional $120,333 |
| Iranians | 100.0 /100 | #8 | Exceptional $120,292 |
| Immigrants | China | 100.0 /100 | #9 | Exceptional $119,756 |
| Indians (Asian) | 100.0 /100 | #10 | Exceptional $119,496 |
| Okinawans | 100.0 /100 | #11 | Exceptional $119,349 |
| Immigrants | Iran | 100.0 /100 | #12 | Exceptional $119,204 |
| Immigrants | Eastern Asia | 100.0 /100 | #13 | Exceptional $118,056 |
| Immigrants | Israel | 100.0 /100 | #14 | Exceptional $117,219 |
| Immigrants | South Central Asia | 100.0 /100 | #15 | Exceptional $116,626 |
| Cypriots | 100.0 /100 | #16 | Exceptional $116,364 |
| Immigrants | Australia | 100.0 /100 | #17 | Exceptional $115,947 |
| Eastern Europeans | 100.0 /100 | #18 | Exceptional $114,523 |
Demographics Similar to Basques by Householder Income Ages 25 - 44 years
In terms of householder income ages 25 - 44 years, the demographic groups most similar to Basques are Irish ($96,730, a difference of 0.020%), Ugandan ($96,667, a difference of 0.040%), Immigrants from Syria ($96,789, a difference of 0.080%), Ethiopian ($96,824, a difference of 0.12%), and Norwegian ($96,866, a difference of 0.16%).
| Demographics | Rating | Rank | Householder Income Ages 25 - 44 years |
| Danes | 81.3 /100 | #142 | Excellent $97,221 |
| Immigrants | Jordan | 81.0 /100 | #143 | Excellent $97,185 |
| Immigrants | Chile | 80.8 /100 | #144 | Excellent $97,159 |
| Norwegians | 78.2 /100 | #145 | Good $96,866 |
| Ethiopians | 77.8 /100 | #146 | Good $96,824 |
| Immigrants | Syria | 77.4 /100 | #147 | Good $96,789 |
| Irish | 76.9 /100 | #148 | Good $96,730 |
| Basques | 76.6 /100 | #149 | Good $96,709 |
| Ugandans | 76.2 /100 | #150 | Good $96,667 |
| Czechs | 74.8 /100 | #151 | Good $96,525 |
| South American Indians | 74.5 /100 | #152 | Good $96,497 |
| Slovenes | 73.9 /100 | #153 | Good $96,439 |
| Slavs | 73.2 /100 | #154 | Good $96,377 |
| Moroccans | 70.3 /100 | #155 | Good $96,117 |
| Immigrants | Germany | 67.9 /100 | #156 | Good $95,913 |