Norwegian vs Italian Median Household Income
COMPARE
Norwegian
Italian
Median Household Income
Median Household Income Comparison
Norwegians
Italians
$86,084
MEDIAN HOUSEHOLD INCOME
65.3/ 100
METRIC RATING
165th/ 347
METRIC RANK
$92,475
MEDIAN HOUSEHOLD INCOME
99.1/ 100
METRIC RATING
83rd/ 347
METRIC RANK
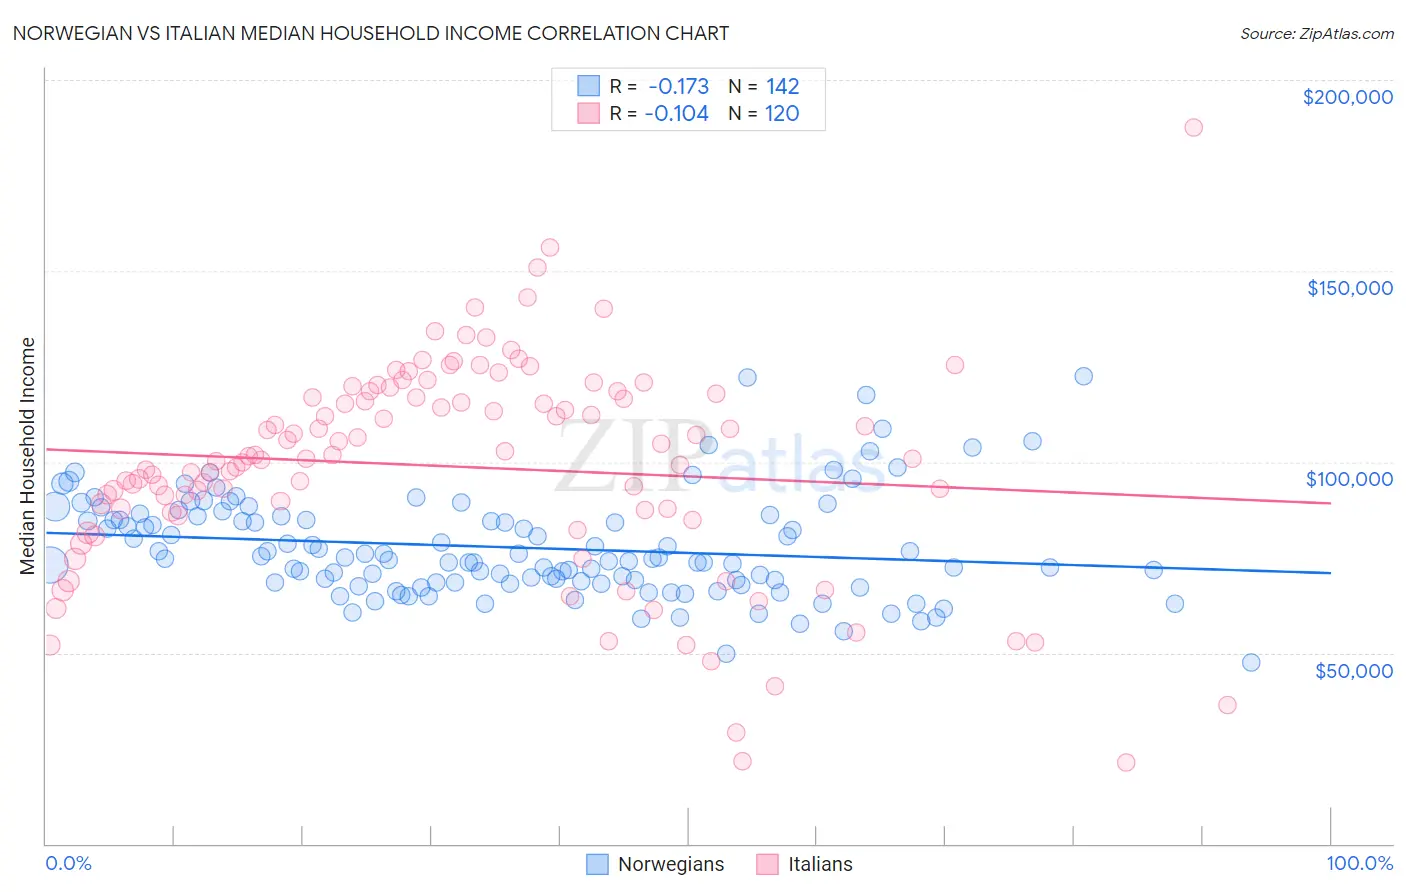
Norwegian vs Italian Median Household Income Correlation Chart
The statistical analysis conducted on geographies consisting of 532,629,578 people shows a poor negative correlation between the proportion of Norwegians and median household income in the United States with a correlation coefficient (R) of -0.173 and weighted average of $86,084. Similarly, the statistical analysis conducted on geographies consisting of 573,867,135 people shows a poor negative correlation between the proportion of Italians and median household income in the United States with a correlation coefficient (R) of -0.104 and weighted average of $92,475, a difference of 7.4%.
Median Household Income Correlation Summary
| Measurement | Norwegian | Italian |
| Minimum | $47,500 | $21,250 |
| Maximum | $122,560 | $187,614 |
| Range | $75,060 | $166,364 |
| Mean | $77,577 | $98,796 |
| Median | $74,729 | $100,721 |
| Interquartile 25% (IQ1) | $68,461 | $86,997 |
| Interquartile 75% (IQ3) | $85,771 | $117,408 |
| Interquartile Range (IQR) | $17,310 | $30,412 |
| Standard Deviation (Sample) | $13,465 | $27,952 |
| Standard Deviation (Population) | $13,417 | $27,836 |
Similar Demographics by Median Household Income
Demographics Similar to Norwegians by Median Household Income
In terms of median household income, the demographic groups most similar to Norwegians are Scandinavian ($86,073, a difference of 0.010%), Irish ($86,145, a difference of 0.070%), Czech ($86,164, a difference of 0.090%), Guamanian/Chamorro ($86,255, a difference of 0.20%), and Immigrants ($85,818, a difference of 0.31%).
| Demographics | Rating | Rank | Median Household Income |
| Moroccans | 70.6 /100 | #158 | Good $86,468 |
| Immigrants | Uzbekistan | 70.1 /100 | #159 | Good $86,425 |
| Luxembourgers | 70.0 /100 | #160 | Good $86,418 |
| Slavs | 69.7 /100 | #161 | Good $86,398 |
| Guamanians/Chamorros | 67.7 /100 | #162 | Good $86,255 |
| Czechs | 66.4 /100 | #163 | Good $86,164 |
| Irish | 66.2 /100 | #164 | Good $86,145 |
| Norwegians | 65.3 /100 | #165 | Good $86,084 |
| Scandinavians | 65.1 /100 | #166 | Good $86,073 |
| Immigrants | Immigrants | 61.3 /100 | #167 | Good $85,818 |
| Icelanders | 61.0 /100 | #168 | Good $85,797 |
| Colombians | 59.7 /100 | #169 | Average $85,716 |
| Swiss | 59.2 /100 | #170 | Average $85,681 |
| Immigrants | South America | 58.1 /100 | #171 | Average $85,611 |
| Slovenes | 57.4 /100 | #172 | Average $85,562 |
Demographics Similar to Italians by Median Household Income
In terms of median household income, the demographic groups most similar to Italians are Immigrants from Argentina ($92,417, a difference of 0.060%), Immigrants from Croatia ($92,225, a difference of 0.27%), Immigrants from Spain ($92,732, a difference of 0.28%), Immigrants from England ($92,098, a difference of 0.41%), and Immigrants from Hungary ($92,094, a difference of 0.41%).
| Demographics | Rating | Rank | Median Household Income |
| South Africans | 99.5 /100 | #76 | Exceptional $93,379 |
| Immigrants | Afghanistan | 99.5 /100 | #77 | Exceptional $93,375 |
| Immigrants | Bulgaria | 99.4 /100 | #78 | Exceptional $93,148 |
| Sri Lankans | 99.4 /100 | #79 | Exceptional $93,093 |
| Tongans | 99.4 /100 | #80 | Exceptional $93,076 |
| Immigrants | Eastern Europe | 99.4 /100 | #81 | Exceptional $93,051 |
| Immigrants | Spain | 99.3 /100 | #82 | Exceptional $92,732 |
| Italians | 99.1 /100 | #83 | Exceptional $92,475 |
| Immigrants | Argentina | 99.1 /100 | #84 | Exceptional $92,417 |
| Immigrants | Croatia | 99.0 /100 | #85 | Exceptional $92,225 |
| Immigrants | England | 98.9 /100 | #86 | Exceptional $92,098 |
| Immigrants | Hungary | 98.9 /100 | #87 | Exceptional $92,094 |
| Immigrants | Canada | 98.8 /100 | #88 | Exceptional $92,029 |
| Romanians | 98.8 /100 | #89 | Exceptional $91,994 |
| Assyrians/Chaldeans/Syriacs | 98.8 /100 | #90 | Exceptional $91,991 |