Norwegian vs Sudanese Median Household Income
COMPARE
Norwegian
Sudanese
Median Household Income
Median Household Income Comparison
Norwegians
Sudanese
$86,084
MEDIAN HOUSEHOLD INCOME
65.3/ 100
METRIC RATING
165th/ 347
METRIC RANK
$78,529
MEDIAN HOUSEHOLD INCOME
1.5/ 100
METRIC RATING
248th/ 347
METRIC RANK
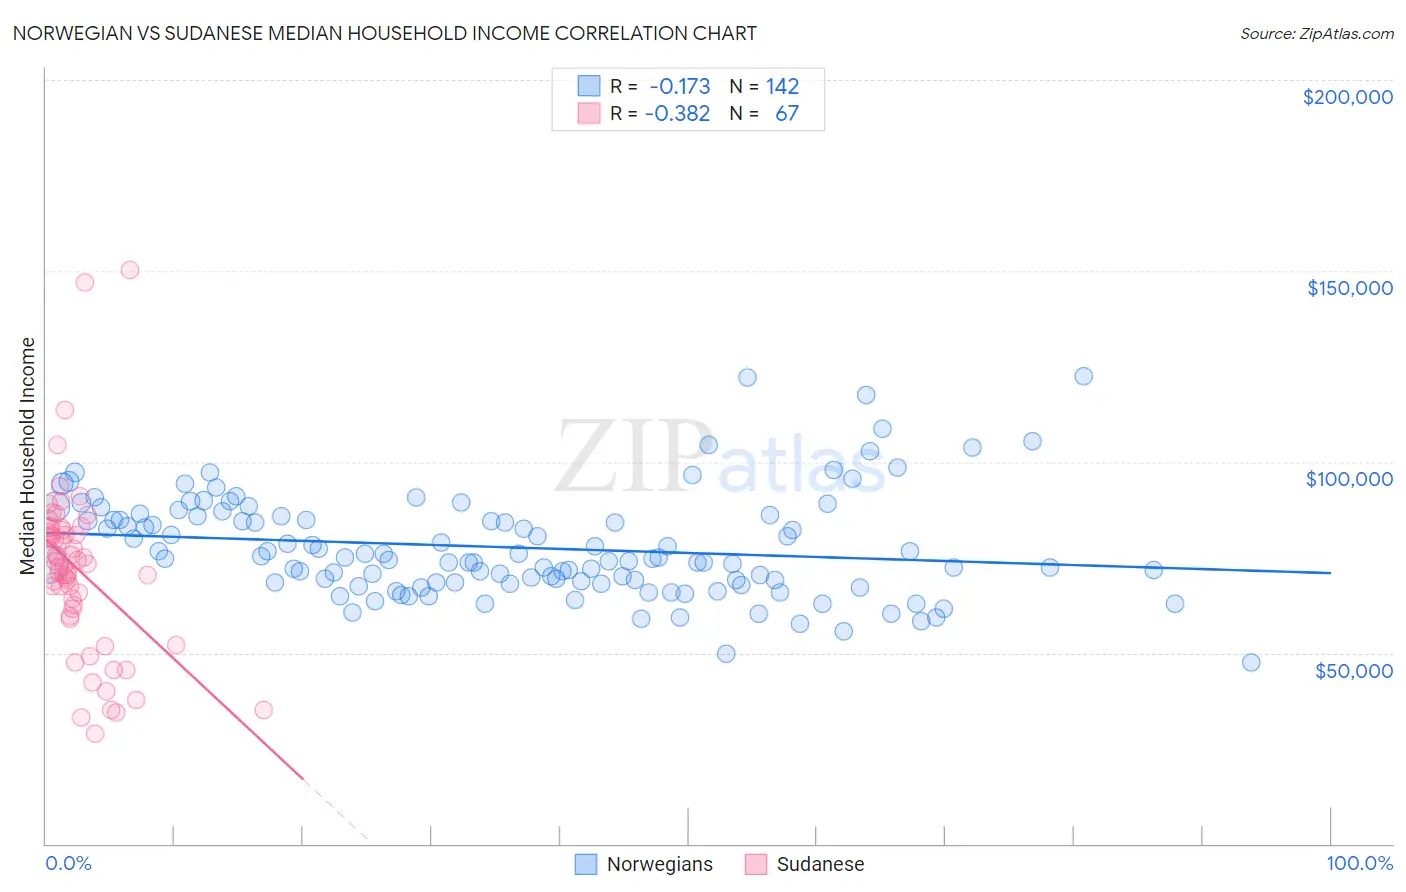
Norwegian vs Sudanese Median Household Income Correlation Chart
The statistical analysis conducted on geographies consisting of 532,629,578 people shows a poor negative correlation between the proportion of Norwegians and median household income in the United States with a correlation coefficient (R) of -0.173 and weighted average of $86,084. Similarly, the statistical analysis conducted on geographies consisting of 110,096,720 people shows a mild negative correlation between the proportion of Sudanese and median household income in the United States with a correlation coefficient (R) of -0.382 and weighted average of $78,529, a difference of 9.6%.
Median Household Income Correlation Summary
| Measurement | Norwegian | Sudanese |
| Minimum | $47,500 | $28,750 |
| Maximum | $122,560 | $150,237 |
| Range | $75,060 | $121,487 |
| Mean | $77,577 | $71,874 |
| Median | $74,729 | $73,369 |
| Interquartile 25% (IQ1) | $68,461 | $61,639 |
| Interquartile 75% (IQ3) | $85,771 | $82,076 |
| Interquartile Range (IQR) | $17,310 | $20,437 |
| Standard Deviation (Sample) | $13,465 | $22,253 |
| Standard Deviation (Population) | $13,417 | $22,086 |
Similar Demographics by Median Household Income
Demographics Similar to Norwegians by Median Household Income
In terms of median household income, the demographic groups most similar to Norwegians are Scandinavian ($86,073, a difference of 0.010%), Irish ($86,145, a difference of 0.070%), Czech ($86,164, a difference of 0.090%), Guamanian/Chamorro ($86,255, a difference of 0.20%), and Immigrants ($85,818, a difference of 0.31%).
| Demographics | Rating | Rank | Median Household Income |
| Moroccans | 70.6 /100 | #158 | Good $86,468 |
| Immigrants | Uzbekistan | 70.1 /100 | #159 | Good $86,425 |
| Luxembourgers | 70.0 /100 | #160 | Good $86,418 |
| Slavs | 69.7 /100 | #161 | Good $86,398 |
| Guamanians/Chamorros | 67.7 /100 | #162 | Good $86,255 |
| Czechs | 66.4 /100 | #163 | Good $86,164 |
| Irish | 66.2 /100 | #164 | Good $86,145 |
| Norwegians | 65.3 /100 | #165 | Good $86,084 |
| Scandinavians | 65.1 /100 | #166 | Good $86,073 |
| Immigrants | Immigrants | 61.3 /100 | #167 | Good $85,818 |
| Icelanders | 61.0 /100 | #168 | Good $85,797 |
| Colombians | 59.7 /100 | #169 | Average $85,716 |
| Swiss | 59.2 /100 | #170 | Average $85,681 |
| Immigrants | South America | 58.1 /100 | #171 | Average $85,611 |
| Slovenes | 57.4 /100 | #172 | Average $85,562 |
Demographics Similar to Sudanese by Median Household Income
In terms of median household income, the demographic groups most similar to Sudanese are West Indian ($78,455, a difference of 0.090%), Immigrants from Burma/Myanmar ($78,682, a difference of 0.19%), Immigrants from Laos ($78,327, a difference of 0.26%), Central American ($78,803, a difference of 0.35%), and Inupiat ($78,841, a difference of 0.40%).
| Demographics | Rating | Rank | Median Household Income |
| Immigrants | Nonimmigrants | 2.6 /100 | #241 | Tragic $79,429 |
| Immigrants | Sudan | 2.1 /100 | #242 | Tragic $79,103 |
| Immigrants | Barbados | 1.9 /100 | #243 | Tragic $78,989 |
| Marshallese | 1.9 /100 | #244 | Tragic $78,930 |
| Inupiat | 1.8 /100 | #245 | Tragic $78,841 |
| Central Americans | 1.7 /100 | #246 | Tragic $78,803 |
| Immigrants | Burma/Myanmar | 1.6 /100 | #247 | Tragic $78,682 |
| Sudanese | 1.5 /100 | #248 | Tragic $78,529 |
| West Indians | 1.4 /100 | #249 | Tragic $78,455 |
| Immigrants | Laos | 1.3 /100 | #250 | Tragic $78,327 |
| Mexican American Indians | 1.2 /100 | #251 | Tragic $78,166 |
| Immigrants | West Indies | 1.0 /100 | #252 | Tragic $77,956 |
| Immigrants | St. Vincent and the Grenadines | 0.9 /100 | #253 | Tragic $77,690 |
| Sub-Saharan Africans | 0.8 /100 | #254 | Tragic $77,631 |
| Immigrants | Middle Africa | 0.8 /100 | #255 | Tragic $77,559 |