Norwegian vs Delaware Median Household Income
COMPARE
Norwegian
Delaware
Median Household Income
Median Household Income Comparison
Norwegians
Delaware
$86,084
MEDIAN HOUSEHOLD INCOME
65.3/ 100
METRIC RATING
165th/ 347
METRIC RANK
$80,527
MEDIAN HOUSEHOLD INCOME
5.0/ 100
METRIC RATING
229th/ 347
METRIC RANK
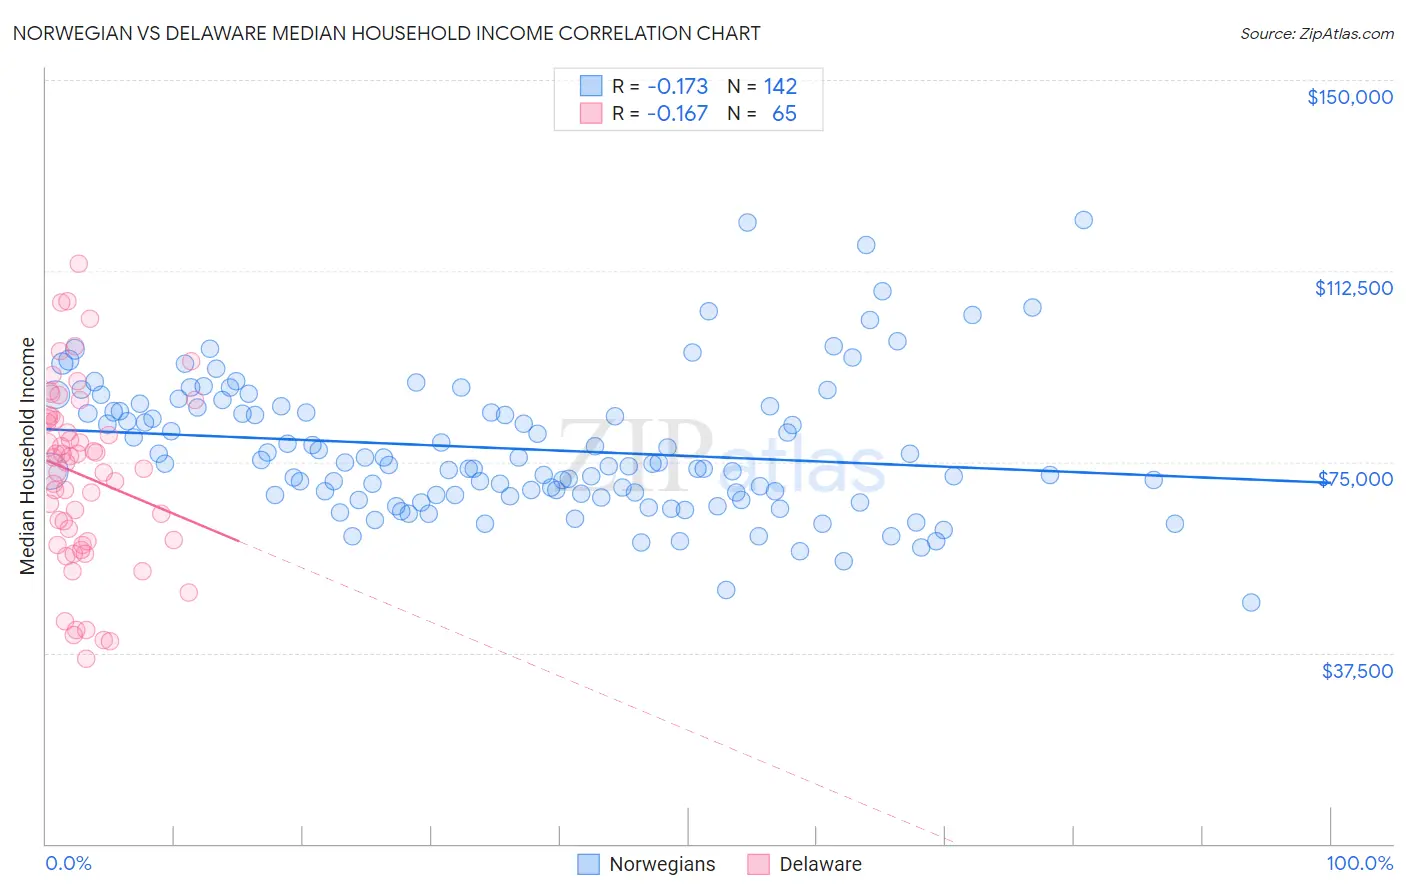
Norwegian vs Delaware Median Household Income Correlation Chart
The statistical analysis conducted on geographies consisting of 532,629,578 people shows a poor negative correlation between the proportion of Norwegians and median household income in the United States with a correlation coefficient (R) of -0.173 and weighted average of $86,084. Similarly, the statistical analysis conducted on geographies consisting of 96,222,020 people shows a poor negative correlation between the proportion of Delaware and median household income in the United States with a correlation coefficient (R) of -0.167 and weighted average of $80,527, a difference of 6.9%.
Median Household Income Correlation Summary
| Measurement | Norwegian | Delaware |
| Minimum | $47,500 | $36,250 |
| Maximum | $122,560 | $113,889 |
| Range | $75,060 | $77,639 |
| Mean | $77,577 | $72,395 |
| Median | $74,729 | $74,896 |
| Interquartile 25% (IQ1) | $68,461 | $59,089 |
| Interquartile 75% (IQ3) | $85,771 | $83,725 |
| Interquartile Range (IQR) | $17,310 | $24,635 |
| Standard Deviation (Sample) | $13,465 | $17,722 |
| Standard Deviation (Population) | $13,417 | $17,585 |
Similar Demographics by Median Household Income
Demographics Similar to Norwegians by Median Household Income
In terms of median household income, the demographic groups most similar to Norwegians are Scandinavian ($86,073, a difference of 0.010%), Irish ($86,145, a difference of 0.070%), Czech ($86,164, a difference of 0.090%), Guamanian/Chamorro ($86,255, a difference of 0.20%), and Immigrants ($85,818, a difference of 0.31%).
| Demographics | Rating | Rank | Median Household Income |
| Moroccans | 70.6 /100 | #158 | Good $86,468 |
| Immigrants | Uzbekistan | 70.1 /100 | #159 | Good $86,425 |
| Luxembourgers | 70.0 /100 | #160 | Good $86,418 |
| Slavs | 69.7 /100 | #161 | Good $86,398 |
| Guamanians/Chamorros | 67.7 /100 | #162 | Good $86,255 |
| Czechs | 66.4 /100 | #163 | Good $86,164 |
| Irish | 66.2 /100 | #164 | Good $86,145 |
| Norwegians | 65.3 /100 | #165 | Good $86,084 |
| Scandinavians | 65.1 /100 | #166 | Good $86,073 |
| Immigrants | Immigrants | 61.3 /100 | #167 | Good $85,818 |
| Icelanders | 61.0 /100 | #168 | Good $85,797 |
| Colombians | 59.7 /100 | #169 | Average $85,716 |
| Swiss | 59.2 /100 | #170 | Average $85,681 |
| Immigrants | South America | 58.1 /100 | #171 | Average $85,611 |
| Slovenes | 57.4 /100 | #172 | Average $85,562 |
Demographics Similar to Delaware by Median Household Income
In terms of median household income, the demographic groups most similar to Delaware are Bermudan ($80,406, a difference of 0.15%), Trinidadian and Tobagonian ($80,402, a difference of 0.16%), Immigrants from Trinidad and Tobago ($80,373, a difference of 0.19%), Immigrants from the Azores ($80,357, a difference of 0.21%), and Immigrants from Ecuador ($80,341, a difference of 0.23%).
| Demographics | Rating | Rank | Median Household Income |
| Immigrants | Nigeria | 7.7 /100 | #222 | Tragic $81,236 |
| Immigrants | El Salvador | 7.6 /100 | #223 | Tragic $81,213 |
| Malaysians | 7.0 /100 | #224 | Tragic $81,064 |
| Scotch-Irish | 6.6 /100 | #225 | Tragic $80,972 |
| Immigrants | Panama | 6.2 /100 | #226 | Tragic $80,873 |
| Guyanese | 5.7 /100 | #227 | Tragic $80,734 |
| Immigrants | Bangladesh | 5.7 /100 | #228 | Tragic $80,722 |
| Delaware | 5.0 /100 | #229 | Tragic $80,527 |
| Bermudans | 4.7 /100 | #230 | Tragic $80,406 |
| Trinidadians and Tobagonians | 4.7 /100 | #231 | Tragic $80,402 |
| Immigrants | Trinidad and Tobago | 4.6 /100 | #232 | Tragic $80,373 |
| Immigrants | Azores | 4.5 /100 | #233 | Tragic $80,357 |
| Immigrants | Ecuador | 4.5 /100 | #234 | Tragic $80,341 |
| Immigrants | Guyana | 4.5 /100 | #235 | Tragic $80,324 |
| Immigrants | Bosnia and Herzegovina | 3.4 /100 | #236 | Tragic $79,888 |