Northern European vs Immigrants from Canada Per Capita Income
COMPARE
Northern European
Immigrants from Canada
Per Capita Income
Per Capita Income Comparison
Northern Europeans
Immigrants from Canada
$47,698
PER CAPITA INCOME
98.9/ 100
METRIC RATING
89th/ 347
METRIC RANK
$49,412
PER CAPITA INCOME
99.8/ 100
METRIC RATING
69th/ 347
METRIC RANK
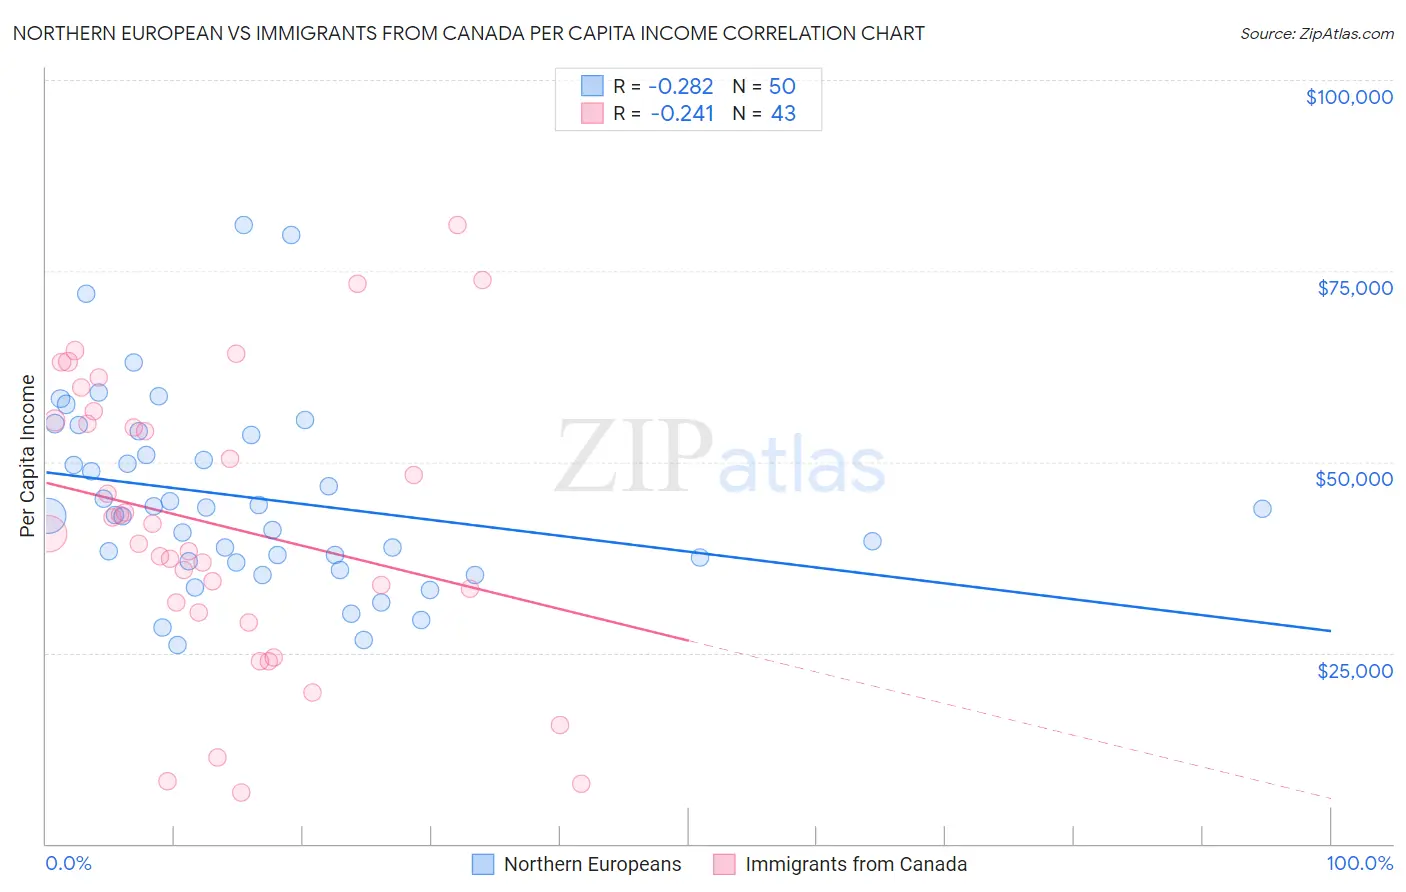
Northern European vs Immigrants from Canada Per Capita Income Correlation Chart
The statistical analysis conducted on geographies consisting of 406,105,495 people shows a weak negative correlation between the proportion of Northern Europeans and per capita income in the United States with a correlation coefficient (R) of -0.282 and weighted average of $47,698. Similarly, the statistical analysis conducted on geographies consisting of 459,409,712 people shows a weak negative correlation between the proportion of Immigrants from Canada and per capita income in the United States with a correlation coefficient (R) of -0.241 and weighted average of $49,412, a difference of 3.6%.
Per Capita Income Correlation Summary
| Measurement | Northern European | Immigrants from Canada |
| Minimum | $26,062 | $6,700 |
| Maximum | $80,940 | $80,940 |
| Range | $54,878 | $74,240 |
| Mean | $45,254 | $41,746 |
| Median | $43,430 | $40,519 |
| Interquartile 25% (IQ1) | $36,923 | $30,302 |
| Interquartile 75% (IQ3) | $53,441 | $55,434 |
| Interquartile Range (IQR) | $16,518 | $25,132 |
| Standard Deviation (Sample) | $12,375 | $18,564 |
| Standard Deviation (Population) | $12,250 | $18,346 |
Demographics Similar to Northern Europeans and Immigrants from Canada by Per Capita Income
In terms of per capita income, the demographic groups most similar to Northern Europeans are Croatian ($47,742, a difference of 0.090%), Ukrainian ($48,014, a difference of 0.66%), Immigrants from Southern Europe ($48,027, a difference of 0.69%), Austrian ($48,116, a difference of 0.88%), and Immigrants from Ukraine ($48,134, a difference of 0.91%). Similarly, the demographic groups most similar to Immigrants from Canada are Immigrants from Eastern Europe ($49,316, a difference of 0.20%), Greek ($49,309, a difference of 0.21%), Immigrants from Hungary ($49,303, a difference of 0.22%), Immigrants from North America ($49,302, a difference of 0.22%), and Mongolian ($49,173, a difference of 0.49%).
| Demographics | Rating | Rank | Per Capita Income |
| Immigrants | Canada | 99.8 /100 | #69 | Exceptional $49,412 |
| Immigrants | Eastern Europe | 99.8 /100 | #70 | Exceptional $49,316 |
| Greeks | 99.8 /100 | #71 | Exceptional $49,309 |
| Immigrants | Hungary | 99.8 /100 | #72 | Exceptional $49,303 |
| Immigrants | North America | 99.8 /100 | #73 | Exceptional $49,302 |
| Mongolians | 99.8 /100 | #74 | Exceptional $49,173 |
| Immigrants | Bolivia | 99.7 /100 | #75 | Exceptional $48,970 |
| Immigrants | England | 99.7 /100 | #76 | Exceptional $48,844 |
| Immigrants | Kazakhstan | 99.7 /100 | #77 | Exceptional $48,747 |
| Immigrants | Italy | 99.6 /100 | #78 | Exceptional $48,654 |
| Romanians | 99.5 /100 | #79 | Exceptional $48,445 |
| Egyptians | 99.5 /100 | #80 | Exceptional $48,358 |
| Armenians | 99.4 /100 | #81 | Exceptional $48,287 |
| Immigrants | Indonesia | 99.4 /100 | #82 | Exceptional $48,195 |
| Immigrants | Brazil | 99.4 /100 | #83 | Exceptional $48,164 |
| Immigrants | Ukraine | 99.3 /100 | #84 | Exceptional $48,134 |
| Austrians | 99.3 /100 | #85 | Exceptional $48,116 |
| Immigrants | Southern Europe | 99.3 /100 | #86 | Exceptional $48,027 |
| Ukrainians | 99.3 /100 | #87 | Exceptional $48,014 |
| Croatians | 99.0 /100 | #88 | Exceptional $47,742 |
| Northern Europeans | 98.9 /100 | #89 | Exceptional $47,698 |