Northern European vs Marshallese Per Capita Income
COMPARE
Northern European
Marshallese
Per Capita Income
Per Capita Income Comparison
Northern Europeans
Marshallese
$47,698
PER CAPITA INCOME
98.9/ 100
METRIC RATING
89th/ 347
METRIC RANK
$39,108
PER CAPITA INCOME
0.6/ 100
METRIC RATING
261st/ 347
METRIC RANK
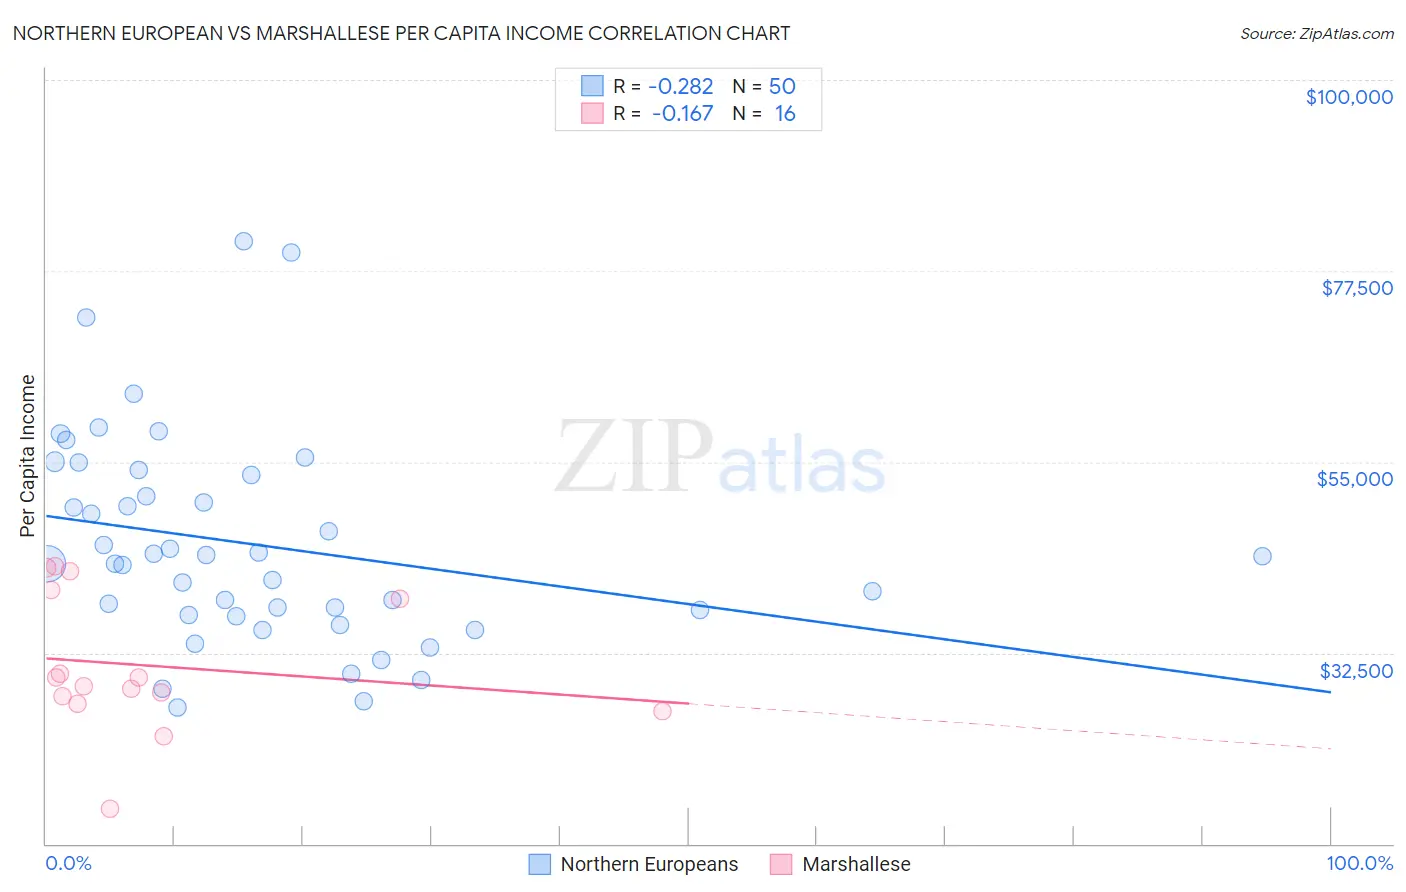
Northern European vs Marshallese Per Capita Income Correlation Chart
The statistical analysis conducted on geographies consisting of 406,105,495 people shows a weak negative correlation between the proportion of Northern Europeans and per capita income in the United States with a correlation coefficient (R) of -0.282 and weighted average of $47,698. Similarly, the statistical analysis conducted on geographies consisting of 14,761,315 people shows a poor negative correlation between the proportion of Marshallese and per capita income in the United States with a correlation coefficient (R) of -0.167 and weighted average of $39,108, a difference of 22.0%.
Per Capita Income Correlation Summary
| Measurement | Northern European | Marshallese |
| Minimum | $26,062 | $14,082 |
| Maximum | $80,940 | $42,763 |
| Range | $54,878 | $28,681 |
| Mean | $45,254 | $31,016 |
| Median | $43,430 | $29,047 |
| Interquartile 25% (IQ1) | $36,923 | $26,970 |
| Interquartile 75% (IQ3) | $53,441 | $39,382 |
| Interquartile Range (IQR) | $16,518 | $12,413 |
| Standard Deviation (Sample) | $12,375 | $8,089 |
| Standard Deviation (Population) | $12,250 | $7,833 |
Similar Demographics by Per Capita Income
Demographics Similar to Northern Europeans by Per Capita Income
In terms of per capita income, the demographic groups most similar to Northern Europeans are Croatian ($47,742, a difference of 0.090%), Italian ($47,574, a difference of 0.26%), Macedonian ($47,573, a difference of 0.26%), Immigrants from Moldova ($47,489, a difference of 0.44%), and Immigrants from Zimbabwe ($47,394, a difference of 0.64%).
| Demographics | Rating | Rank | Per Capita Income |
| Immigrants | Indonesia | 99.4 /100 | #82 | Exceptional $48,195 |
| Immigrants | Brazil | 99.4 /100 | #83 | Exceptional $48,164 |
| Immigrants | Ukraine | 99.3 /100 | #84 | Exceptional $48,134 |
| Austrians | 99.3 /100 | #85 | Exceptional $48,116 |
| Immigrants | Southern Europe | 99.3 /100 | #86 | Exceptional $48,027 |
| Ukrainians | 99.3 /100 | #87 | Exceptional $48,014 |
| Croatians | 99.0 /100 | #88 | Exceptional $47,742 |
| Northern Europeans | 98.9 /100 | #89 | Exceptional $47,698 |
| Italians | 98.8 /100 | #90 | Exceptional $47,574 |
| Macedonians | 98.8 /100 | #91 | Exceptional $47,573 |
| Immigrants | Moldova | 98.7 /100 | #92 | Exceptional $47,489 |
| Immigrants | Zimbabwe | 98.5 /100 | #93 | Exceptional $47,394 |
| Albanians | 98.5 /100 | #94 | Exceptional $47,379 |
| Immigrants | Egypt | 98.5 /100 | #95 | Exceptional $47,361 |
| Alsatians | 98.3 /100 | #96 | Exceptional $47,284 |
Demographics Similar to Marshallese by Per Capita Income
In terms of per capita income, the demographic groups most similar to Marshallese are Iroquois ($39,104, a difference of 0.010%), Belizean ($39,097, a difference of 0.030%), Alaskan Athabascan ($39,163, a difference of 0.14%), American ($39,039, a difference of 0.17%), and Malaysian ($39,194, a difference of 0.22%).
| Demographics | Rating | Rank | Per Capita Income |
| Alaska Natives | 1.0 /100 | #254 | Tragic $39,558 |
| Immigrants | Middle Africa | 1.0 /100 | #255 | Tragic $39,529 |
| Hawaiians | 0.8 /100 | #256 | Tragic $39,403 |
| Nicaraguans | 0.8 /100 | #257 | Tragic $39,372 |
| Jamaicans | 0.7 /100 | #258 | Tragic $39,231 |
| Malaysians | 0.7 /100 | #259 | Tragic $39,194 |
| Alaskan Athabascans | 0.6 /100 | #260 | Tragic $39,163 |
| Marshallese | 0.6 /100 | #261 | Tragic $39,108 |
| Iroquois | 0.6 /100 | #262 | Tragic $39,104 |
| Belizeans | 0.6 /100 | #263 | Tragic $39,097 |
| Americans | 0.6 /100 | #264 | Tragic $39,039 |
| Spanish Americans | 0.5 /100 | #265 | Tragic $39,012 |
| Salvadorans | 0.5 /100 | #266 | Tragic $38,858 |
| Immigrants | Zaire | 0.4 /100 | #267 | Tragic $38,848 |
| Liberians | 0.4 /100 | #268 | Tragic $38,780 |