Northern European vs Seminole Vision Disability
COMPARE
Northern European
Seminole
Vision Disability
Vision Disability Comparison
Northern Europeans
Seminole
2.2%
VISION DISABILITY
50.1/ 100
METRIC RATING
172nd/ 347
METRIC RANK
3.1%
VISION DISABILITY
0.0/ 100
METRIC RATING
332nd/ 347
METRIC RANK
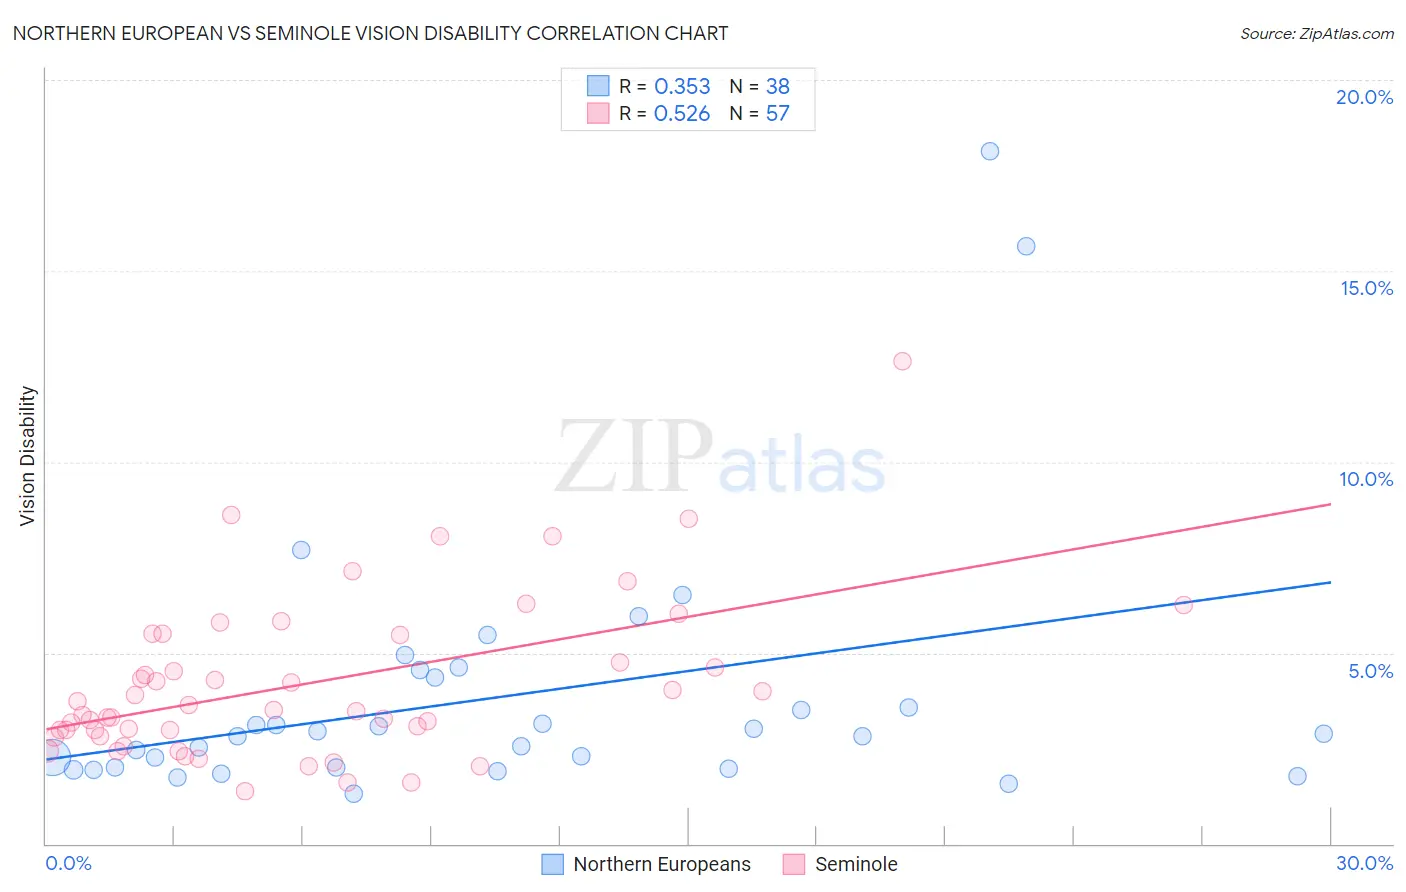
Northern European vs Seminole Vision Disability Correlation Chart
The statistical analysis conducted on geographies consisting of 405,711,615 people shows a mild positive correlation between the proportion of Northern Europeans and percentage of population with vision disability in the United States with a correlation coefficient (R) of 0.353 and weighted average of 2.2%. Similarly, the statistical analysis conducted on geographies consisting of 118,301,889 people shows a substantial positive correlation between the proportion of Seminole and percentage of population with vision disability in the United States with a correlation coefficient (R) of 0.526 and weighted average of 3.1%, a difference of 41.2%.
Vision Disability Correlation Summary
| Measurement | Northern European | Seminole |
| Minimum | 1.3% | 1.4% |
| Maximum | 18.1% | 12.6% |
| Range | 16.8% | 11.2% |
| Mean | 3.8% | 4.2% |
| Median | 2.8% | 3.5% |
| Interquartile 25% (IQ1) | 2.0% | 2.9% |
| Interquartile 75% (IQ3) | 4.4% | 5.5% |
| Interquartile Range (IQR) | 2.4% | 2.6% |
| Standard Deviation (Sample) | 3.5% | 2.1% |
| Standard Deviation (Population) | 3.4% | 2.1% |
Similar Demographics by Vision Disability
Demographics Similar to Northern Europeans by Vision Disability
In terms of vision disability, the demographic groups most similar to Northern Europeans are Scandinavian (2.2%, a difference of 0.0%), Immigrants from Canada (2.2%, a difference of 0.010%), Immigrants from Fiji (2.2%, a difference of 0.16%), Yugoslavian (2.2%, a difference of 0.22%), and Lebanese (2.2%, a difference of 0.26%).
| Demographics | Rating | Rank | Vision Disability |
| Immigrants | Iraq | 64.8 /100 | #165 | Good 2.1% |
| Immigrants | England | 62.8 /100 | #166 | Good 2.1% |
| Immigrants | Africa | 62.6 /100 | #167 | Good 2.1% |
| Brazilians | 62.2 /100 | #168 | Good 2.1% |
| South American Indians | 57.4 /100 | #169 | Average 2.2% |
| Swiss | 55.7 /100 | #170 | Average 2.2% |
| Lebanese | 54.3 /100 | #171 | Average 2.2% |
| Northern Europeans | 50.1 /100 | #172 | Average 2.2% |
| Scandinavians | 50.0 /100 | #173 | Average 2.2% |
| Immigrants | Canada | 50.0 /100 | #174 | Average 2.2% |
| Immigrants | Fiji | 47.6 /100 | #175 | Average 2.2% |
| Yugoslavians | 46.5 /100 | #176 | Average 2.2% |
| Slavs | 46.0 /100 | #177 | Average 2.2% |
| Immigrants | Oceania | 45.1 /100 | #178 | Average 2.2% |
| Immigrants | North America | 44.5 /100 | #179 | Average 2.2% |
Demographics Similar to Seminole by Vision Disability
In terms of vision disability, the demographic groups most similar to Seminole are Cajun (3.1%, a difference of 0.010%), Central American Indian (3.0%, a difference of 0.43%), Colville (3.0%, a difference of 1.1%), Cheyenne (3.1%, a difference of 1.1%), and Apache (3.0%, a difference of 2.3%).
| Demographics | Rating | Rank | Vision Disability |
| Cherokee | 0.0 /100 | #325 | Tragic 2.9% |
| Spanish Americans | 0.0 /100 | #326 | Tragic 2.9% |
| Natives/Alaskans | 0.0 /100 | #327 | Tragic 3.0% |
| Yuman | 0.0 /100 | #328 | Tragic 3.0% |
| Apache | 0.0 /100 | #329 | Tragic 3.0% |
| Colville | 0.0 /100 | #330 | Tragic 3.0% |
| Central American Indians | 0.0 /100 | #331 | Tragic 3.0% |
| Seminole | 0.0 /100 | #332 | Tragic 3.1% |
| Cajuns | 0.0 /100 | #333 | Tragic 3.1% |
| Cheyenne | 0.0 /100 | #334 | Tragic 3.1% |
| Navajo | 0.0 /100 | #335 | Tragic 3.1% |
| Alaskan Athabascans | 0.0 /100 | #336 | Tragic 3.1% |
| Dutch West Indians | 0.0 /100 | #337 | Tragic 3.2% |
| Chickasaw | 0.0 /100 | #338 | Tragic 3.2% |
| Tsimshian | 0.0 /100 | #339 | Tragic 3.2% |