Nonimmigrants vs Somali Female Unemployment
COMPARE
Nonimmigrants
Somali
Female Unemployment
Female Unemployment Comparison
Nonimmigrants
Somalis
5.3%
FEMALE UNEMPLOYMENT
42.6/ 100
METRIC RATING
182nd/ 347
METRIC RANK
5.0%
FEMALE UNEMPLOYMENT
94.6/ 100
METRIC RATING
103rd/ 347
METRIC RANK
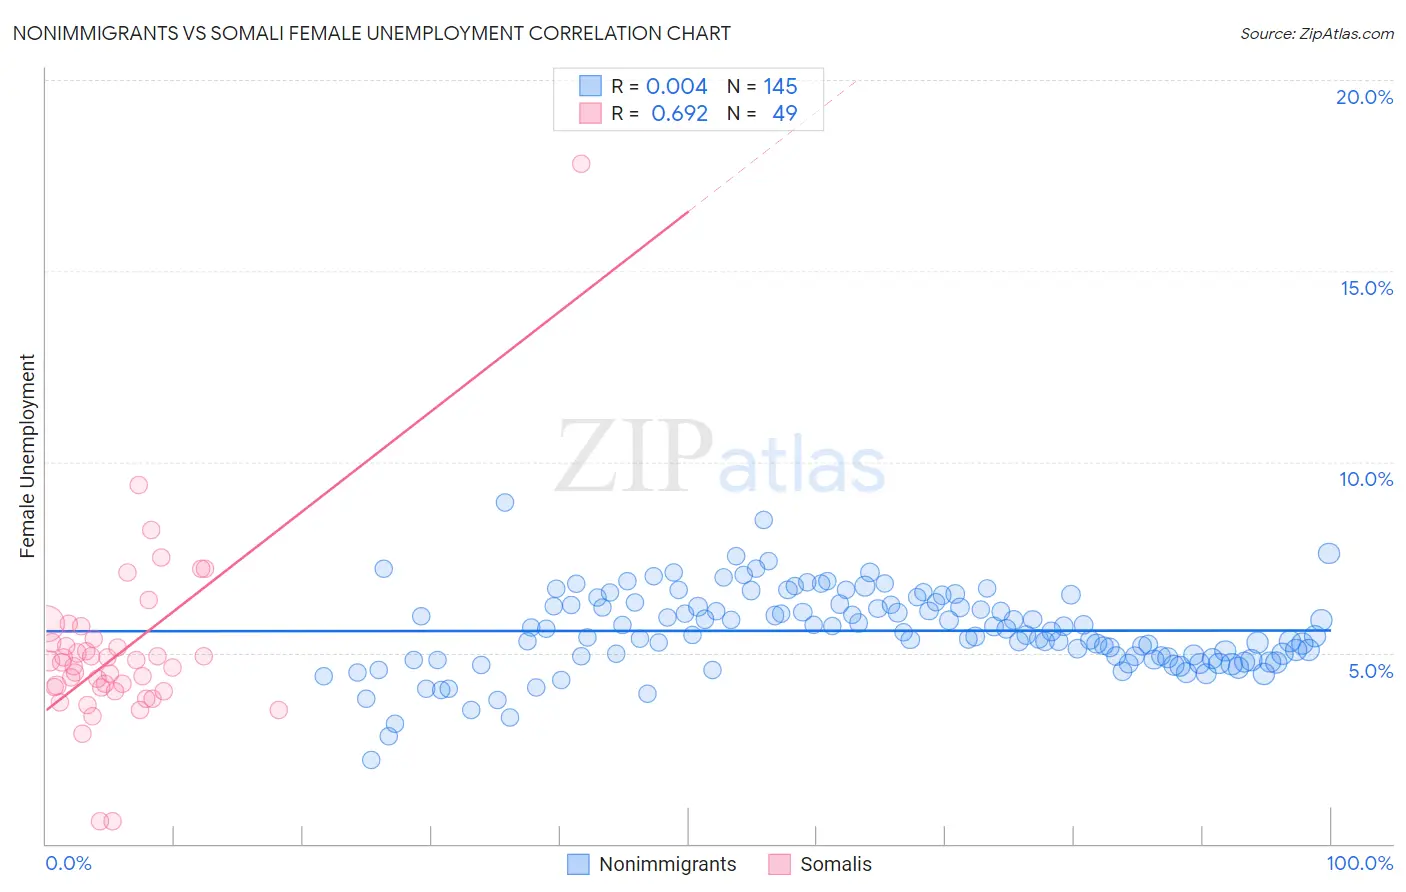
Nonimmigrants vs Somali Female Unemployment Correlation Chart
The statistical analysis conducted on geographies consisting of 567,351,562 people shows no correlation between the proportion of Nonimmigrants and unemploymnet rate among females in the United States with a correlation coefficient (R) of 0.004 and weighted average of 5.3%. Similarly, the statistical analysis conducted on geographies consisting of 99,208,507 people shows a significant positive correlation between the proportion of Somalis and unemploymnet rate among females in the United States with a correlation coefficient (R) of 0.692 and weighted average of 5.0%, a difference of 5.0%.
Female Unemployment Correlation Summary
| Measurement | Nonimmigrants | Somali |
| Minimum | 2.2% | 0.60% |
| Maximum | 9.0% | 17.8% |
| Range | 6.8% | 17.2% |
| Mean | 5.6% | 5.0% |
| Median | 5.5% | 4.8% |
| Interquartile 25% (IQ1) | 4.8% | 4.0% |
| Interquartile 75% (IQ3) | 6.3% | 5.3% |
| Interquartile Range (IQR) | 1.4% | 1.3% |
| Standard Deviation (Sample) | 1.1% | 2.4% |
| Standard Deviation (Population) | 1.1% | 2.4% |
Similar Demographics by Female Unemployment
Demographics Similar to Nonimmigrants by Female Unemployment
In terms of female unemployment, the demographic groups most similar to Nonimmigrants are Taiwanese (5.3%, a difference of 0.010%), Immigrants from Congo (5.3%, a difference of 0.030%), Immigrants from Indonesia (5.3%, a difference of 0.12%), Laotian (5.3%, a difference of 0.15%), and Immigrants from Ukraine (5.3%, a difference of 0.15%).
| Demographics | Rating | Rank | Female Unemployment |
| Immigrants | Laos | 47.5 /100 | #175 | Average 5.3% |
| Immigrants | Vietnam | 47.5 /100 | #176 | Average 5.3% |
| Immigrants | Morocco | 47.4 /100 | #177 | Average 5.3% |
| Immigrants | Southern Europe | 46.2 /100 | #178 | Average 5.3% |
| Laotians | 45.1 /100 | #179 | Average 5.3% |
| Immigrants | Congo | 43.1 /100 | #180 | Average 5.3% |
| Taiwanese | 42.7 /100 | #181 | Average 5.3% |
| Immigrants | Nonimmigrants | 42.6 /100 | #182 | Average 5.3% |
| Immigrants | Indonesia | 40.7 /100 | #183 | Average 5.3% |
| Immigrants | Ukraine | 40.1 /100 | #184 | Average 5.3% |
| Malaysians | 40.1 /100 | #185 | Average 5.3% |
| Immigrants | Belarus | 39.4 /100 | #186 | Fair 5.3% |
| Immigrants | Albania | 35.4 /100 | #187 | Fair 5.3% |
| Afghans | 33.9 /100 | #188 | Fair 5.3% |
| Costa Ricans | 33.8 /100 | #189 | Fair 5.3% |
Demographics Similar to Somalis by Female Unemployment
In terms of female unemployment, the demographic groups most similar to Somalis are Immigrants from Kenya (5.0%, a difference of 0.080%), Immigrants from Czechoslovakia (5.0%, a difference of 0.13%), Indonesian (5.0%, a difference of 0.17%), Immigrants from Zaire (5.0%, a difference of 0.19%), and Immigrants from Somalia (5.0%, a difference of 0.20%).
| Demographics | Rating | Rank | Female Unemployment |
| Immigrants | South Central Asia | 95.5 /100 | #96 | Exceptional 5.0% |
| Immigrants | Somalia | 95.2 /100 | #97 | Exceptional 5.0% |
| Immigrants | Kuwait | 95.2 /100 | #98 | Exceptional 5.0% |
| Immigrants | Zaire | 95.2 /100 | #99 | Exceptional 5.0% |
| Indonesians | 95.1 /100 | #100 | Exceptional 5.0% |
| Immigrants | Czechoslovakia | 95.0 /100 | #101 | Exceptional 5.0% |
| Immigrants | Kenya | 94.8 /100 | #102 | Exceptional 5.0% |
| Somalis | 94.6 /100 | #103 | Exceptional 5.0% |
| Kenyans | 93.7 /100 | #104 | Exceptional 5.0% |
| Immigrants | England | 93.6 /100 | #105 | Exceptional 5.0% |
| Paraguayans | 93.2 /100 | #106 | Exceptional 5.1% |
| Immigrants | Switzerland | 93.1 /100 | #107 | Exceptional 5.1% |
| Puget Sound Salish | 93.0 /100 | #108 | Exceptional 5.1% |
| Immigrants | Eastern Africa | 92.8 /100 | #109 | Exceptional 5.1% |
| Macedonians | 92.4 /100 | #110 | Exceptional 5.1% |