Nonimmigrants vs Immigrants from Bangladesh Median Family Income
COMPARE
Nonimmigrants
Immigrants from Bangladesh
Median Family Income
Median Family Income Comparison
Nonimmigrants
Immigrants from Bangladesh
$96,231
MEDIAN FAMILY INCOME
3.6/ 100
METRIC RATING
224th/ 347
METRIC RANK
$94,665
MEDIAN FAMILY INCOME
1.6/ 100
METRIC RATING
233rd/ 347
METRIC RANK
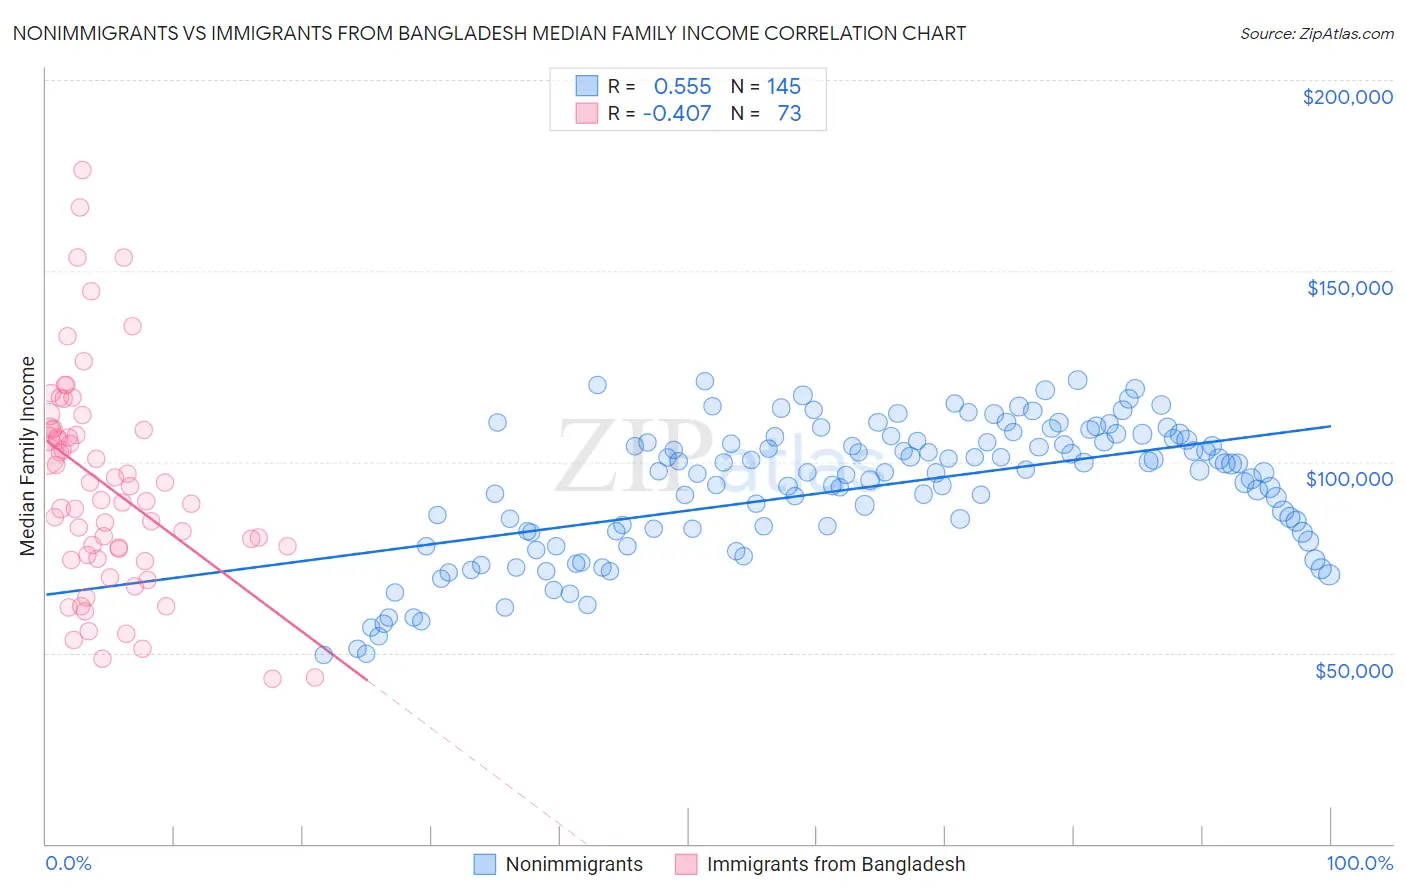
Nonimmigrants vs Immigrants from Bangladesh Median Family Income Correlation Chart
The statistical analysis conducted on geographies consisting of 582,429,666 people shows a substantial positive correlation between the proportion of Nonimmigrants and median family income in the United States with a correlation coefficient (R) of 0.555 and weighted average of $96,231. Similarly, the statistical analysis conducted on geographies consisting of 203,503,484 people shows a moderate negative correlation between the proportion of Immigrants from Bangladesh and median family income in the United States with a correlation coefficient (R) of -0.407 and weighted average of $94,665, a difference of 1.7%.
Median Family Income Correlation Summary
| Measurement | Nonimmigrants | Immigrants from Bangladesh |
| Minimum | $49,547 | $43,315 |
| Maximum | $121,513 | $176,322 |
| Range | $71,966 | $133,007 |
| Mean | $93,127 | $93,798 |
| Median | $97,277 | $90,050 |
| Interquartile 25% (IQ1) | $81,657 | $75,060 |
| Interquartile 75% (IQ3) | $105,547 | $108,612 |
| Interquartile Range (IQR) | $23,890 | $33,553 |
| Standard Deviation (Sample) | $17,276 | $28,054 |
| Standard Deviation (Population) | $17,216 | $27,861 |
Demographics Similar to Nonimmigrants and Immigrants from Bangladesh by Median Family Income
In terms of median family income, the demographic groups most similar to Nonimmigrants are Venezuelan ($96,281, a difference of 0.050%), Vietnamese ($96,123, a difference of 0.11%), Immigrants from Nigeria ($96,439, a difference of 0.22%), Immigrants from Ghana ($96,544, a difference of 0.33%), and Sudanese ($96,783, a difference of 0.57%). Similarly, the demographic groups most similar to Immigrants from Bangladesh are Immigrants from Western Africa ($94,638, a difference of 0.030%), Immigrants from Burma/Myanmar ($94,472, a difference of 0.20%), Trinidadian and Tobagonian ($94,466, a difference of 0.21%), Immigrants from Venezuela ($94,904, a difference of 0.25%), and Alaskan Athabascan ($94,429, a difference of 0.25%).
| Demographics | Rating | Rank | Median Family Income |
| Immigrants | Cambodia | 5.8 /100 | #218 | Tragic $97,222 |
| Delaware | 5.1 /100 | #219 | Tragic $96,958 |
| Sudanese | 4.7 /100 | #220 | Tragic $96,783 |
| Immigrants | Ghana | 4.2 /100 | #221 | Tragic $96,544 |
| Immigrants | Nigeria | 4.0 /100 | #222 | Tragic $96,439 |
| Venezuelans | 3.7 /100 | #223 | Tragic $96,281 |
| Immigrants | Nonimmigrants | 3.6 /100 | #224 | Tragic $96,231 |
| Vietnamese | 3.4 /100 | #225 | Tragic $96,123 |
| Immigrants | Panama | 2.7 /100 | #226 | Tragic $95,647 |
| Alaska Natives | 2.6 /100 | #227 | Tragic $95,573 |
| Immigrants | Azores | 2.4 /100 | #228 | Tragic $95,402 |
| Marshallese | 2.2 /100 | #229 | Tragic $95,293 |
| Malaysians | 2.2 /100 | #230 | Tragic $95,230 |
| Ecuadorians | 2.1 /100 | #231 | Tragic $95,114 |
| Immigrants | Venezuela | 1.9 /100 | #232 | Tragic $94,904 |
| Immigrants | Bangladesh | 1.6 /100 | #233 | Tragic $94,665 |
| Immigrants | Western Africa | 1.6 /100 | #234 | Tragic $94,638 |
| Immigrants | Burma/Myanmar | 1.5 /100 | #235 | Tragic $94,472 |
| Trinidadians and Tobagonians | 1.5 /100 | #236 | Tragic $94,466 |
| Alaskan Athabascans | 1.5 /100 | #237 | Tragic $94,429 |
| Nepalese | 1.3 /100 | #238 | Tragic $94,153 |