Nigerian vs Immigrants from Mexico Householder Income Over 65 years
COMPARE
Nigerian
Immigrants from Mexico
Householder Income Over 65 years
Householder Income Over 65 years Comparison
Nigerians
Immigrants from Mexico
$58,992
HOUSEHOLDER INCOME OVER 65 YEARS
11.2/ 100
METRIC RATING
210th/ 347
METRIC RANK
$52,801
HOUSEHOLDER INCOME OVER 65 YEARS
0.0/ 100
METRIC RATING
308th/ 347
METRIC RANK
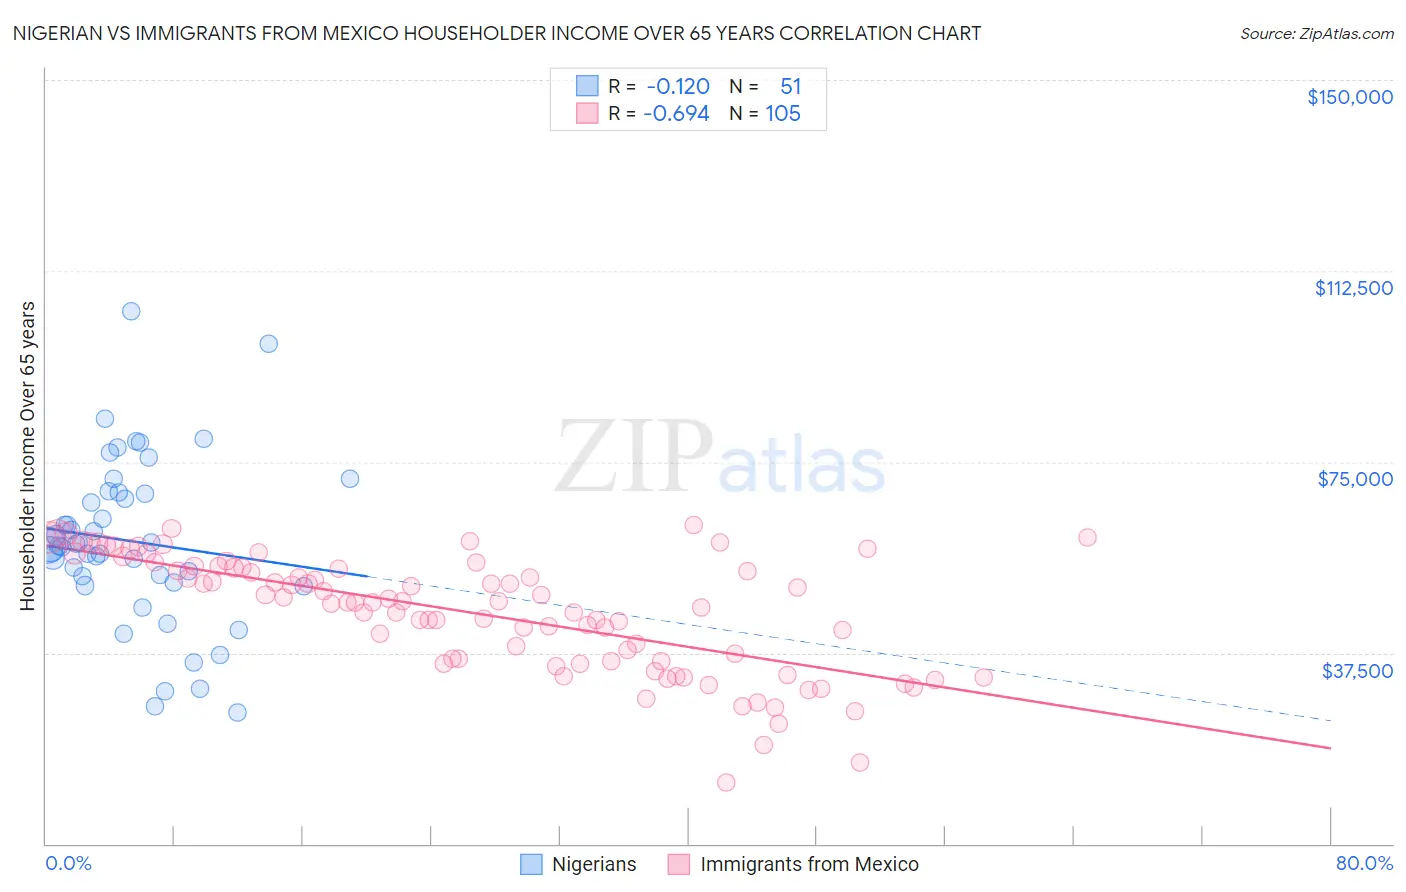
Nigerian vs Immigrants from Mexico Householder Income Over 65 years Correlation Chart
The statistical analysis conducted on geographies consisting of 331,517,190 people shows a poor negative correlation between the proportion of Nigerians and household income with householder over the age of 65 in the United States with a correlation coefficient (R) of -0.120 and weighted average of $58,992. Similarly, the statistical analysis conducted on geographies consisting of 510,126,392 people shows a significant negative correlation between the proportion of Immigrants from Mexico and household income with householder over the age of 65 in the United States with a correlation coefficient (R) of -0.694 and weighted average of $52,801, a difference of 11.7%.
Householder Income Over 65 years Correlation Summary
| Measurement | Nigerian | Immigrants from Mexico |
| Minimum | $25,694 | $11,979 |
| Maximum | $104,625 | $62,508 |
| Range | $78,931 | $50,529 |
| Mean | $59,394 | $45,341 |
| Median | $58,564 | $47,467 |
| Interquartile 25% (IQ1) | $51,335 | $35,778 |
| Interquartile 75% (IQ3) | $68,991 | $54,433 |
| Interquartile Range (IQR) | $17,656 | $18,654 |
| Standard Deviation (Sample) | $16,370 | $11,387 |
| Standard Deviation (Population) | $16,209 | $11,333 |
Similar Demographics by Householder Income Over 65 years
Demographics Similar to Nigerians by Householder Income Over 65 years
In terms of householder income over 65 years, the demographic groups most similar to Nigerians are Slovak ($59,039, a difference of 0.080%), Immigrants from Nigeria ($58,942, a difference of 0.090%), Uruguayan ($59,090, a difference of 0.17%), Colombian ($58,851, a difference of 0.24%), and Salvadoran ($59,141, a difference of 0.25%).
| Demographics | Rating | Rank | Householder Income Over 65 years |
| Scotch-Irish | 16.9 /100 | #203 | Poor $59,447 |
| Arapaho | 16.0 /100 | #204 | Poor $59,383 |
| Immigrants | Sudan | 14.2 /100 | #205 | Poor $59,248 |
| Immigrants | South America | 13.0 /100 | #206 | Poor $59,151 |
| Salvadorans | 12.9 /100 | #207 | Poor $59,141 |
| Uruguayans | 12.3 /100 | #208 | Poor $59,090 |
| Slovaks | 11.7 /100 | #209 | Poor $59,039 |
| Nigerians | 11.2 /100 | #210 | Poor $58,992 |
| Immigrants | Nigeria | 10.7 /100 | #211 | Poor $58,942 |
| Colombians | 9.8 /100 | #212 | Tragic $58,851 |
| Whites/Caucasians | 9.8 /100 | #213 | Tragic $58,847 |
| Nepalese | 9.0 /100 | #214 | Tragic $58,761 |
| Immigrants | Ghana | 7.9 /100 | #215 | Tragic $58,624 |
| Immigrants | Middle Africa | 6.2 /100 | #216 | Tragic $58,375 |
| Sudanese | 5.7 /100 | #217 | Tragic $58,281 |
Demographics Similar to Immigrants from Mexico by Householder Income Over 65 years
In terms of householder income over 65 years, the demographic groups most similar to Immigrants from Mexico are Hispanic or Latino ($52,832, a difference of 0.060%), Pennsylvania German ($52,888, a difference of 0.17%), Pueblo ($52,930, a difference of 0.24%), Ute ($52,949, a difference of 0.28%), and Honduran ($52,634, a difference of 0.32%).
| Demographics | Rating | Rank | Householder Income Over 65 years |
| Yuman | 0.0 /100 | #301 | Tragic $53,110 |
| Spanish American Indians | 0.0 /100 | #302 | Tragic $53,077 |
| Choctaw | 0.0 /100 | #303 | Tragic $53,060 |
| Ute | 0.0 /100 | #304 | Tragic $52,949 |
| Pueblo | 0.0 /100 | #305 | Tragic $52,930 |
| Pennsylvania Germans | 0.0 /100 | #306 | Tragic $52,888 |
| Hispanics or Latinos | 0.0 /100 | #307 | Tragic $52,832 |
| Immigrants | Mexico | 0.0 /100 | #308 | Tragic $52,801 |
| Hondurans | 0.0 /100 | #309 | Tragic $52,634 |
| Sioux | 0.0 /100 | #310 | Tragic $52,509 |
| Seminole | 0.0 /100 | #311 | Tragic $52,373 |
| Immigrants | Azores | 0.0 /100 | #312 | Tragic $52,121 |
| Immigrants | Nicaragua | 0.0 /100 | #313 | Tragic $52,085 |
| Natives/Alaskans | 0.0 /100 | #314 | Tragic $52,081 |
| U.S. Virgin Islanders | 0.0 /100 | #315 | Tragic $52,072 |