Immigrants from Jordan vs Immigrants from Mexico Householder Income Over 65 years
COMPARE
Immigrants from Jordan
Immigrants from Mexico
Householder Income Over 65 years
Householder Income Over 65 years Comparison
Immigrants from Jordan
Immigrants from Mexico
$63,041
HOUSEHOLDER INCOME OVER 65 YEARS
89.8/ 100
METRIC RATING
119th/ 347
METRIC RANK
$52,801
HOUSEHOLDER INCOME OVER 65 YEARS
0.0/ 100
METRIC RATING
308th/ 347
METRIC RANK
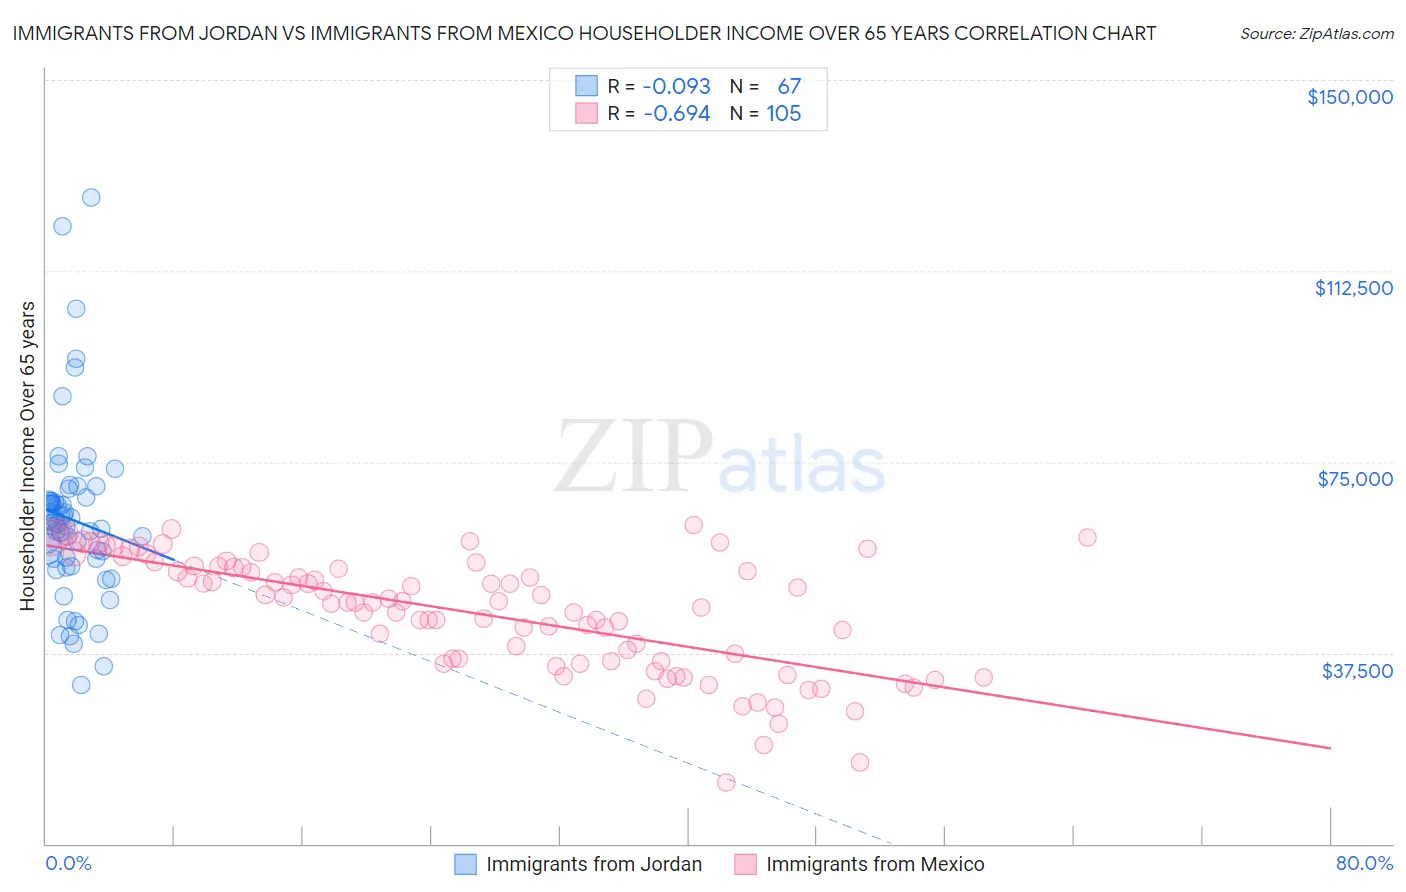
Immigrants from Jordan vs Immigrants from Mexico Householder Income Over 65 years Correlation Chart
The statistical analysis conducted on geographies consisting of 181,136,935 people shows a slight negative correlation between the proportion of Immigrants from Jordan and household income with householder over the age of 65 in the United States with a correlation coefficient (R) of -0.093 and weighted average of $63,041. Similarly, the statistical analysis conducted on geographies consisting of 510,126,392 people shows a significant negative correlation between the proportion of Immigrants from Mexico and household income with householder over the age of 65 in the United States with a correlation coefficient (R) of -0.694 and weighted average of $52,801, a difference of 19.4%.
Householder Income Over 65 years Correlation Summary
| Measurement | Immigrants from Jordan | Immigrants from Mexico |
| Minimum | $31,244 | $11,979 |
| Maximum | $126,912 | $62,508 |
| Range | $95,668 | $50,529 |
| Mean | $63,669 | $45,341 |
| Median | $62,862 | $47,467 |
| Interquartile 25% (IQ1) | $55,944 | $35,778 |
| Interquartile 75% (IQ3) | $67,482 | $54,433 |
| Interquartile Range (IQR) | $11,537 | $18,654 |
| Standard Deviation (Sample) | $16,989 | $11,387 |
| Standard Deviation (Population) | $16,862 | $11,333 |
Similar Demographics by Householder Income Over 65 years
Demographics Similar to Immigrants from Jordan by Householder Income Over 65 years
In terms of householder income over 65 years, the demographic groups most similar to Immigrants from Jordan are Ukrainian ($63,032, a difference of 0.010%), Immigrants from Vietnam ($63,014, a difference of 0.040%), Danish ($63,117, a difference of 0.12%), Immigrants from Moldova ($62,939, a difference of 0.16%), and Tlingit-Haida ($62,922, a difference of 0.19%).
| Demographics | Rating | Rank | Householder Income Over 65 years |
| Syrians | 93.4 /100 | #112 | Exceptional $63,494 |
| Immigrants | Serbia | 92.7 /100 | #113 | Exceptional $63,387 |
| Immigrants | Saudi Arabia | 92.4 /100 | #114 | Exceptional $63,355 |
| Croatians | 91.4 /100 | #115 | Exceptional $63,225 |
| Guamanians/Chamorros | 91.1 /100 | #116 | Exceptional $63,187 |
| Immigrants | Croatia | 90.9 /100 | #117 | Exceptional $63,168 |
| Danes | 90.5 /100 | #118 | Exceptional $63,117 |
| Immigrants | Jordan | 89.8 /100 | #119 | Excellent $63,041 |
| Ukrainians | 89.7 /100 | #120 | Excellent $63,032 |
| Immigrants | Vietnam | 89.5 /100 | #121 | Excellent $63,014 |
| Immigrants | Moldova | 88.7 /100 | #122 | Excellent $62,939 |
| Tlingit-Haida | 88.6 /100 | #123 | Excellent $62,922 |
| Taiwanese | 88.3 /100 | #124 | Excellent $62,894 |
| Soviet Union | 87.8 /100 | #125 | Excellent $62,848 |
| Peruvians | 86.8 /100 | #126 | Excellent $62,766 |
Demographics Similar to Immigrants from Mexico by Householder Income Over 65 years
In terms of householder income over 65 years, the demographic groups most similar to Immigrants from Mexico are Hispanic or Latino ($52,832, a difference of 0.060%), Pennsylvania German ($52,888, a difference of 0.17%), Pueblo ($52,930, a difference of 0.24%), Ute ($52,949, a difference of 0.28%), and Honduran ($52,634, a difference of 0.32%).
| Demographics | Rating | Rank | Householder Income Over 65 years |
| Yuman | 0.0 /100 | #301 | Tragic $53,110 |
| Spanish American Indians | 0.0 /100 | #302 | Tragic $53,077 |
| Choctaw | 0.0 /100 | #303 | Tragic $53,060 |
| Ute | 0.0 /100 | #304 | Tragic $52,949 |
| Pueblo | 0.0 /100 | #305 | Tragic $52,930 |
| Pennsylvania Germans | 0.0 /100 | #306 | Tragic $52,888 |
| Hispanics or Latinos | 0.0 /100 | #307 | Tragic $52,832 |
| Immigrants | Mexico | 0.0 /100 | #308 | Tragic $52,801 |
| Hondurans | 0.0 /100 | #309 | Tragic $52,634 |
| Sioux | 0.0 /100 | #310 | Tragic $52,509 |
| Seminole | 0.0 /100 | #311 | Tragic $52,373 |
| Immigrants | Azores | 0.0 /100 | #312 | Tragic $52,121 |
| Immigrants | Nicaragua | 0.0 /100 | #313 | Tragic $52,085 |
| Natives/Alaskans | 0.0 /100 | #314 | Tragic $52,081 |
| U.S. Virgin Islanders | 0.0 /100 | #315 | Tragic $52,072 |