Bahamian vs Immigrants from Mexico Householder Income Over 65 years
COMPARE
Bahamian
Immigrants from Mexico
Householder Income Over 65 years
Householder Income Over 65 years Comparison
Bahamians
Immigrants from Mexico
$51,000
HOUSEHOLDER INCOME OVER 65 YEARS
0.0/ 100
METRIC RATING
327th/ 347
METRIC RANK
$52,801
HOUSEHOLDER INCOME OVER 65 YEARS
0.0/ 100
METRIC RATING
308th/ 347
METRIC RANK
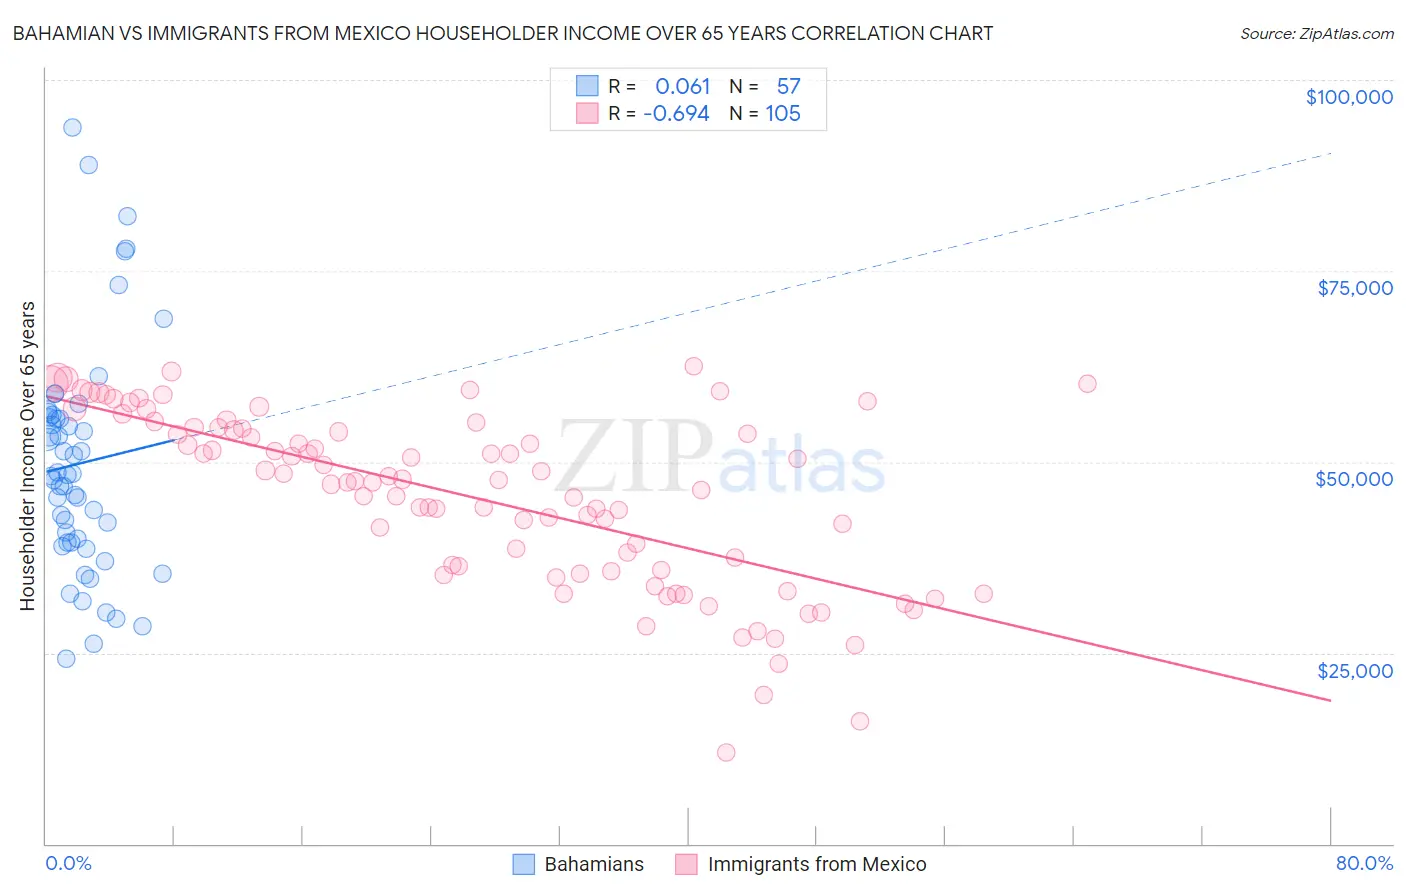
Bahamian vs Immigrants from Mexico Householder Income Over 65 years Correlation Chart
The statistical analysis conducted on geographies consisting of 112,449,613 people shows a slight positive correlation between the proportion of Bahamians and household income with householder over the age of 65 in the United States with a correlation coefficient (R) of 0.061 and weighted average of $51,000. Similarly, the statistical analysis conducted on geographies consisting of 510,126,392 people shows a significant negative correlation between the proportion of Immigrants from Mexico and household income with householder over the age of 65 in the United States with a correlation coefficient (R) of -0.694 and weighted average of $52,801, a difference of 3.5%.
Householder Income Over 65 years Correlation Summary
| Measurement | Bahamian | Immigrants from Mexico |
| Minimum | $24,158 | $11,979 |
| Maximum | $93,779 | $62,508 |
| Range | $69,621 | $50,529 |
| Mean | $49,773 | $45,341 |
| Median | $48,251 | $47,467 |
| Interquartile 25% (IQ1) | $39,444 | $35,778 |
| Interquartile 75% (IQ3) | $55,975 | $54,433 |
| Interquartile Range (IQR) | $16,531 | $18,654 |
| Standard Deviation (Sample) | $14,935 | $11,387 |
| Standard Deviation (Population) | $14,804 | $11,333 |
Demographics Similar to Bahamians and Immigrants from Mexico by Householder Income Over 65 years
In terms of householder income over 65 years, the demographic groups most similar to Bahamians are Kiowa ($51,140, a difference of 0.28%), Immigrants from Haiti ($51,219, a difference of 0.43%), Immigrants from Congo ($51,393, a difference of 0.77%), Cajun ($51,397, a difference of 0.78%), and British West Indian ($51,463, a difference of 0.91%). Similarly, the demographic groups most similar to Immigrants from Mexico are Hispanic or Latino ($52,832, a difference of 0.060%), Honduran ($52,634, a difference of 0.32%), Sioux ($52,509, a difference of 0.56%), Seminole ($52,373, a difference of 0.82%), and Immigrants from the Azores ($52,121, a difference of 1.3%).
| Demographics | Rating | Rank | Householder Income Over 65 years |
| Hispanics or Latinos | 0.0 /100 | #307 | Tragic $52,832 |
| Immigrants | Mexico | 0.0 /100 | #308 | Tragic $52,801 |
| Hondurans | 0.0 /100 | #309 | Tragic $52,634 |
| Sioux | 0.0 /100 | #310 | Tragic $52,509 |
| Seminole | 0.0 /100 | #311 | Tragic $52,373 |
| Immigrants | Azores | 0.0 /100 | #312 | Tragic $52,121 |
| Immigrants | Nicaragua | 0.0 /100 | #313 | Tragic $52,085 |
| Natives/Alaskans | 0.0 /100 | #314 | Tragic $52,081 |
| U.S. Virgin Islanders | 0.0 /100 | #315 | Tragic $52,072 |
| Creek | 0.0 /100 | #316 | Tragic $51,949 |
| Immigrants | St. Vincent and the Grenadines | 0.0 /100 | #317 | Tragic $51,922 |
| Haitians | 0.0 /100 | #318 | Tragic $51,912 |
| Immigrants | Honduras | 0.0 /100 | #319 | Tragic $51,888 |
| Colville | 0.0 /100 | #320 | Tragic $51,739 |
| Menominee | 0.0 /100 | #321 | Tragic $51,719 |
| British West Indians | 0.0 /100 | #322 | Tragic $51,463 |
| Cajuns | 0.0 /100 | #323 | Tragic $51,397 |
| Immigrants | Congo | 0.0 /100 | #324 | Tragic $51,393 |
| Immigrants | Haiti | 0.0 /100 | #325 | Tragic $51,219 |
| Kiowa | 0.0 /100 | #326 | Tragic $51,140 |
| Bahamians | 0.0 /100 | #327 | Tragic $51,000 |