Nicaraguan vs Alsatian Householder Income Ages 25 - 44 years
COMPARE
Nicaraguan
Alsatian
Householder Income Ages 25 - 44 years
Householder Income Ages 25 - 44 years Comparison
Nicaraguans
Alsatians
$87,751
HOUSEHOLDER INCOME AGES 25 - 44 YEARS
2.2/ 100
METRIC RATING
240th/ 347
METRIC RANK
$95,059
HOUSEHOLDER INCOME AGES 25 - 44 YEARS
56.8/ 100
METRIC RATING
168th/ 347
METRIC RANK
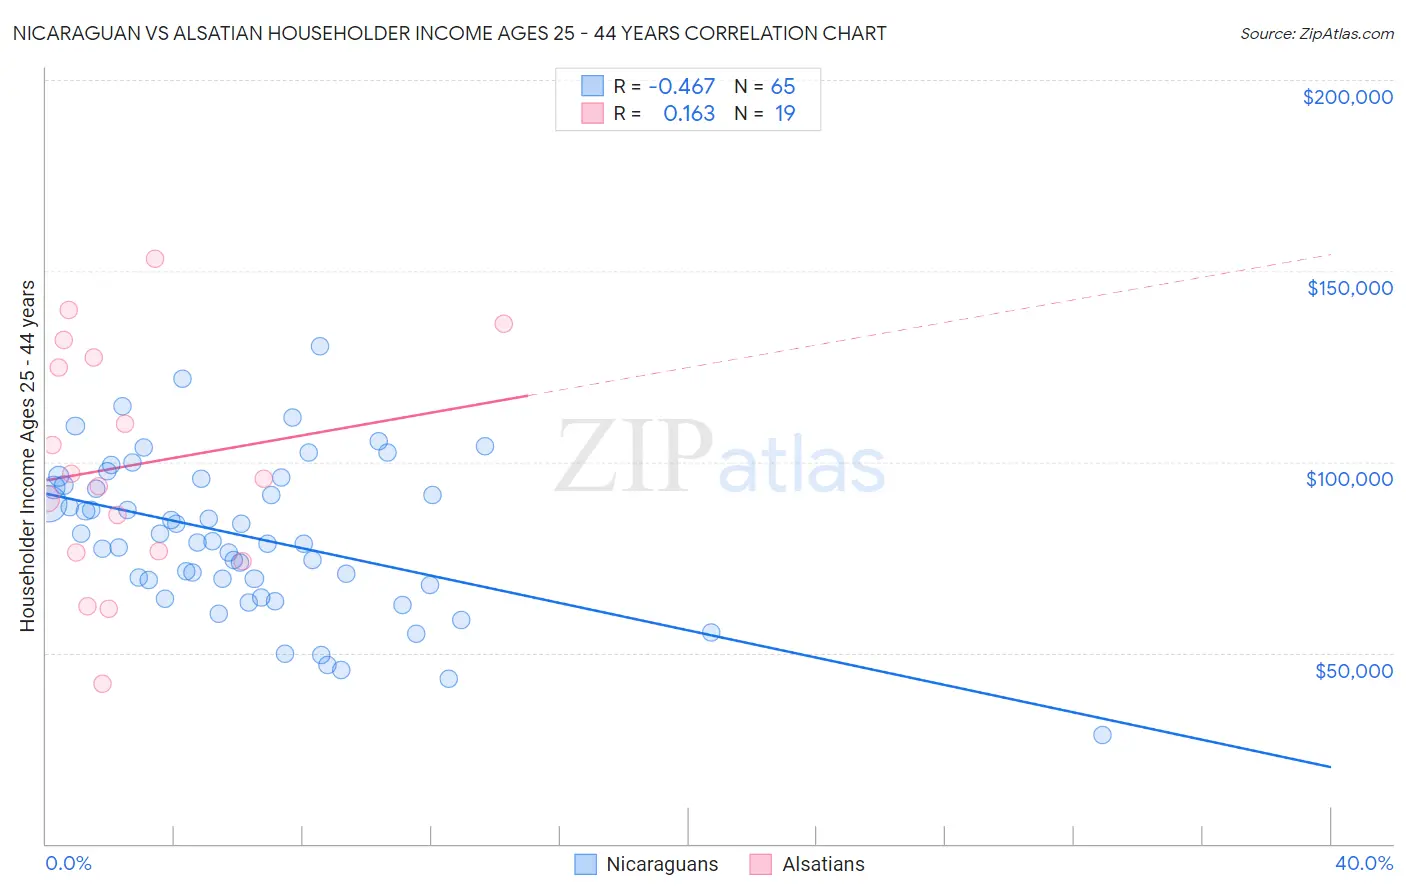
Nicaraguan vs Alsatian Householder Income Ages 25 - 44 years Correlation Chart
The statistical analysis conducted on geographies consisting of 285,307,176 people shows a moderate negative correlation between the proportion of Nicaraguans and household income with householder between the ages 25 and 44 in the United States with a correlation coefficient (R) of -0.467 and weighted average of $87,751. Similarly, the statistical analysis conducted on geographies consisting of 82,595,947 people shows a poor positive correlation between the proportion of Alsatians and household income with householder between the ages 25 and 44 in the United States with a correlation coefficient (R) of 0.163 and weighted average of $95,059, a difference of 8.3%.
Householder Income Ages 25 - 44 years Correlation Summary
| Measurement | Nicaraguan | Alsatian |
| Minimum | $28,500 | $42,026 |
| Maximum | $130,179 | $153,077 |
| Range | $101,679 | $111,051 |
| Mean | $80,440 | $99,110 |
| Median | $79,185 | $95,529 |
| Interquartile 25% (IQ1) | $68,448 | $76,336 |
| Interquartile 75% (IQ3) | $94,672 | $127,229 |
| Interquartile Range (IQR) | $26,224 | $50,893 |
| Standard Deviation (Sample) | $20,031 | $30,381 |
| Standard Deviation (Population) | $19,876 | $29,570 |
Similar Demographics by Householder Income Ages 25 - 44 years
Demographics Similar to Nicaraguans by Householder Income Ages 25 - 44 years
In terms of householder income ages 25 - 44 years, the demographic groups most similar to Nicaraguans are Immigrants from Ghana ($87,760, a difference of 0.010%), Nigerian ($87,730, a difference of 0.020%), Alaska Native ($88,018, a difference of 0.30%), Salvadoran ($88,198, a difference of 0.51%), and Immigrants from Cameroon ($88,214, a difference of 0.53%).
| Demographics | Rating | Rank | Householder Income Ages 25 - 44 years |
| Malaysians | 3.0 /100 | #233 | Tragic $88,291 |
| Venezuelans | 2.9 /100 | #234 | Tragic $88,232 |
| Bermudans | 2.9 /100 | #235 | Tragic $88,231 |
| Immigrants | Cameroon | 2.9 /100 | #236 | Tragic $88,214 |
| Salvadorans | 2.8 /100 | #237 | Tragic $88,198 |
| Alaska Natives | 2.6 /100 | #238 | Tragic $88,018 |
| Immigrants | Ghana | 2.2 /100 | #239 | Tragic $87,760 |
| Nicaraguans | 2.2 /100 | #240 | Tragic $87,751 |
| Nigerians | 2.2 /100 | #241 | Tragic $87,730 |
| West Indians | 1.7 /100 | #242 | Tragic $87,205 |
| Immigrants | West Indies | 1.5 /100 | #243 | Tragic $87,063 |
| Immigrants | Venezuela | 1.5 /100 | #244 | Tragic $87,038 |
| Immigrants | El Salvador | 1.4 /100 | #245 | Tragic $86,913 |
| Immigrants | Burma/Myanmar | 1.3 /100 | #246 | Tragic $86,736 |
| Immigrants | Nigeria | 1.2 /100 | #247 | Tragic $86,589 |
Demographics Similar to Alsatians by Householder Income Ages 25 - 44 years
In terms of householder income ages 25 - 44 years, the demographic groups most similar to Alsatians are Native Hawaiian ($95,058, a difference of 0.0%), Czechoslovakian ($95,070, a difference of 0.010%), Slovak ($95,032, a difference of 0.030%), Immigrants from Armenia ($94,867, a difference of 0.20%), and Immigrants from Ethiopia ($95,256, a difference of 0.21%).
| Demographics | Rating | Rank | Householder Income Ages 25 - 44 years |
| Immigrants | Portugal | 62.8 /100 | #161 | Good $95,512 |
| Swiss | 62.8 /100 | #162 | Good $95,511 |
| Immigrants | Saudi Arabia | 62.0 /100 | #163 | Good $95,450 |
| South Americans | 60.9 /100 | #164 | Good $95,362 |
| Immigrants | Nepal | 60.3 /100 | #165 | Good $95,322 |
| Immigrants | Ethiopia | 59.5 /100 | #166 | Average $95,256 |
| Czechoslovakians | 57.0 /100 | #167 | Average $95,070 |
| Alsatians | 56.8 /100 | #168 | Average $95,059 |
| Native Hawaiians | 56.8 /100 | #169 | Average $95,058 |
| Slovaks | 56.4 /100 | #170 | Average $95,032 |
| Immigrants | Armenia | 54.2 /100 | #171 | Average $94,867 |
| Scottish | 50.8 /100 | #172 | Average $94,622 |
| Finns | 50.6 /100 | #173 | Average $94,610 |
| Colombians | 50.0 /100 | #174 | Average $94,565 |
| English | 48.1 /100 | #175 | Average $94,429 |