Nicaraguan vs Immigrants from Belarus Disability Age 18 to 34
COMPARE
Nicaraguan
Immigrants from Belarus
Disability Age 18 to 34
Disability Age 18 to 34 Comparison
Nicaraguans
Immigrants from Belarus
5.8%
DISABILITY AGE 18 TO 34
99.9/ 100
METRIC RATING
41st/ 347
METRIC RANK
5.9%
DISABILITY AGE 18 TO 34
99.8/ 100
METRIC RATING
49th/ 347
METRIC RANK
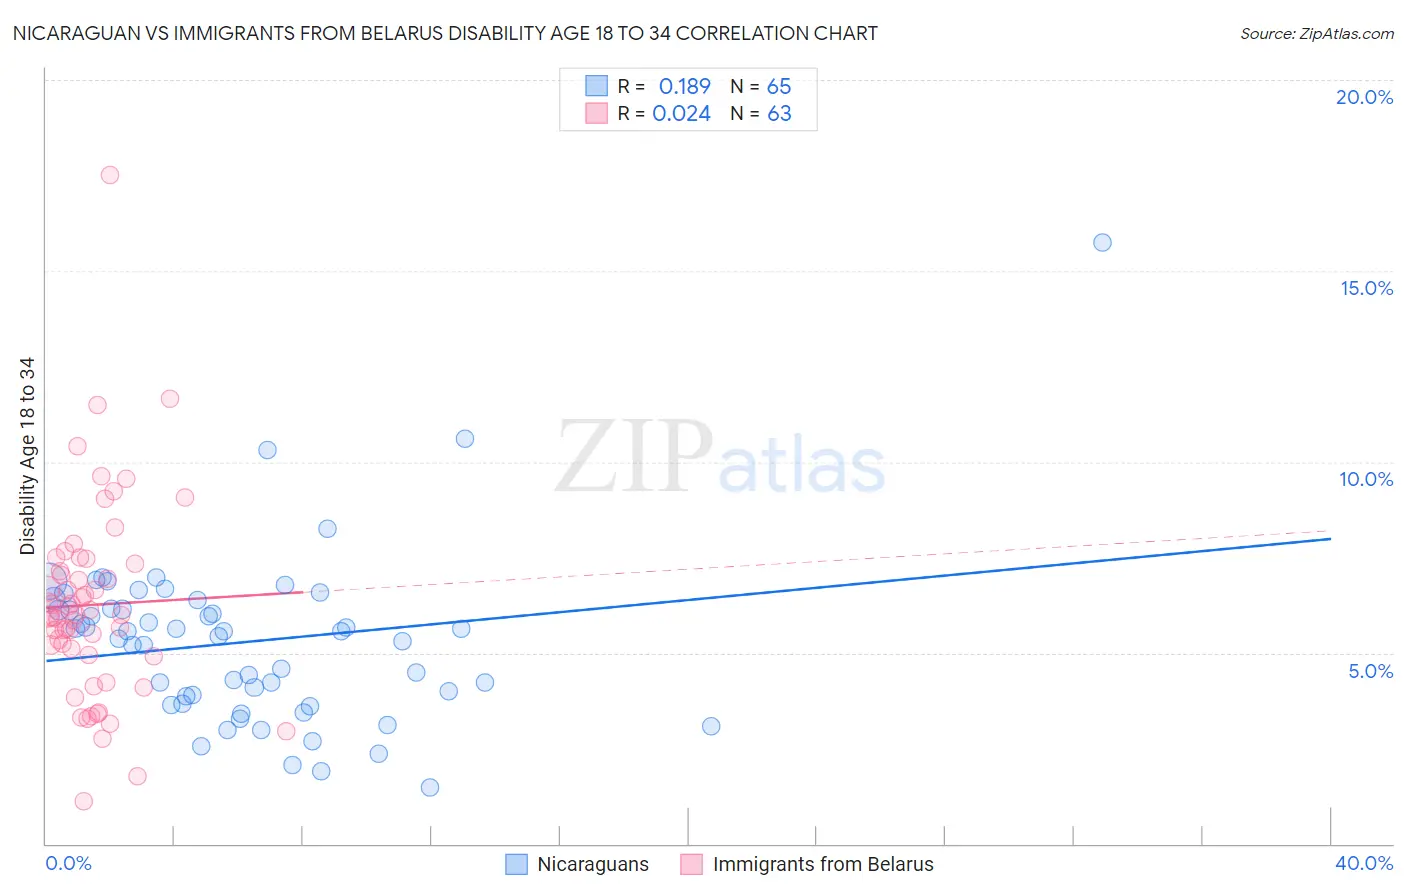
Nicaraguan vs Immigrants from Belarus Disability Age 18 to 34 Correlation Chart
The statistical analysis conducted on geographies consisting of 285,455,320 people shows a poor positive correlation between the proportion of Nicaraguans and percentage of population with a disability between the ages 18 and 35 in the United States with a correlation coefficient (R) of 0.189 and weighted average of 5.8%. Similarly, the statistical analysis conducted on geographies consisting of 150,056,630 people shows no correlation between the proportion of Immigrants from Belarus and percentage of population with a disability between the ages 18 and 35 in the United States with a correlation coefficient (R) of 0.024 and weighted average of 5.9%, a difference of 1.1%.
Disability Age 18 to 34 Correlation Summary
| Measurement | Nicaraguan | Immigrants from Belarus |
| Minimum | 1.5% | 1.1% |
| Maximum | 15.7% | 17.5% |
| Range | 14.3% | 16.4% |
| Mean | 5.3% | 6.3% |
| Median | 5.6% | 6.0% |
| Interquartile 25% (IQ1) | 3.8% | 4.9% |
| Interquartile 75% (IQ3) | 6.3% | 7.3% |
| Interquartile Range (IQR) | 2.5% | 2.4% |
| Standard Deviation (Sample) | 2.2% | 2.6% |
| Standard Deviation (Population) | 2.2% | 2.6% |
Demographics Similar to Nicaraguans and Immigrants from Belarus by Disability Age 18 to 34
In terms of disability age 18 to 34, the demographic groups most similar to Nicaraguans are Bolivian (5.8%, a difference of 0.18%), Colombian (5.9%, a difference of 0.22%), South American (5.9%, a difference of 0.23%), Immigrants from Asia (5.9%, a difference of 0.25%), and Asian (5.8%, a difference of 0.26%). Similarly, the demographic groups most similar to Immigrants from Belarus are Immigrants from El Salvador (5.9%, a difference of 0.040%), Egyptian (5.9%, a difference of 0.040%), Immigrants from Trinidad and Tobago (5.9%, a difference of 0.10%), Okinawan (5.9%, a difference of 0.18%), and Immigrants from Indonesia (5.9%, a difference of 0.32%).
| Demographics | Rating | Rank | Disability Age 18 to 34 |
| Immigrants | Lithuania | 99.9 /100 | #35 | Exceptional 5.8% |
| Ecuadorians | 99.9 /100 | #36 | Exceptional 5.8% |
| Armenians | 99.9 /100 | #37 | Exceptional 5.8% |
| Immigrants | South America | 99.9 /100 | #38 | Exceptional 5.8% |
| Asians | 99.9 /100 | #39 | Exceptional 5.8% |
| Bolivians | 99.9 /100 | #40 | Exceptional 5.8% |
| Nicaraguans | 99.9 /100 | #41 | Exceptional 5.8% |
| Colombians | 99.8 /100 | #42 | Exceptional 5.9% |
| South Americans | 99.8 /100 | #43 | Exceptional 5.9% |
| Immigrants | Asia | 99.8 /100 | #44 | Exceptional 5.9% |
| Immigrants | Peru | 99.8 /100 | #45 | Exceptional 5.9% |
| Immigrants | Korea | 99.8 /100 | #46 | Exceptional 5.9% |
| Immigrants | Egypt | 99.8 /100 | #47 | Exceptional 5.9% |
| Immigrants | Trinidad and Tobago | 99.8 /100 | #48 | Exceptional 5.9% |
| Immigrants | Belarus | 99.8 /100 | #49 | Exceptional 5.9% |
| Immigrants | El Salvador | 99.8 /100 | #50 | Exceptional 5.9% |
| Egyptians | 99.8 /100 | #51 | Exceptional 5.9% |
| Okinawans | 99.7 /100 | #52 | Exceptional 5.9% |
| Immigrants | Indonesia | 99.7 /100 | #53 | Exceptional 5.9% |
| Immigrants | Malaysia | 99.7 /100 | #54 | Exceptional 5.9% |
| Immigrants | Spain | 99.7 /100 | #55 | Exceptional 5.9% |