Nicaraguan vs Finnish 8th Grade
COMPARE
Nicaraguan
Finnish
8th Grade
8th Grade Comparison
Nicaraguans
Finns
93.0%
8TH GRADE
0.0/ 100
METRIC RATING
322nd/ 347
METRIC RANK
98.4%
8TH GRADE
100.0/ 100
METRIC RATING
3rd/ 347
METRIC RANK
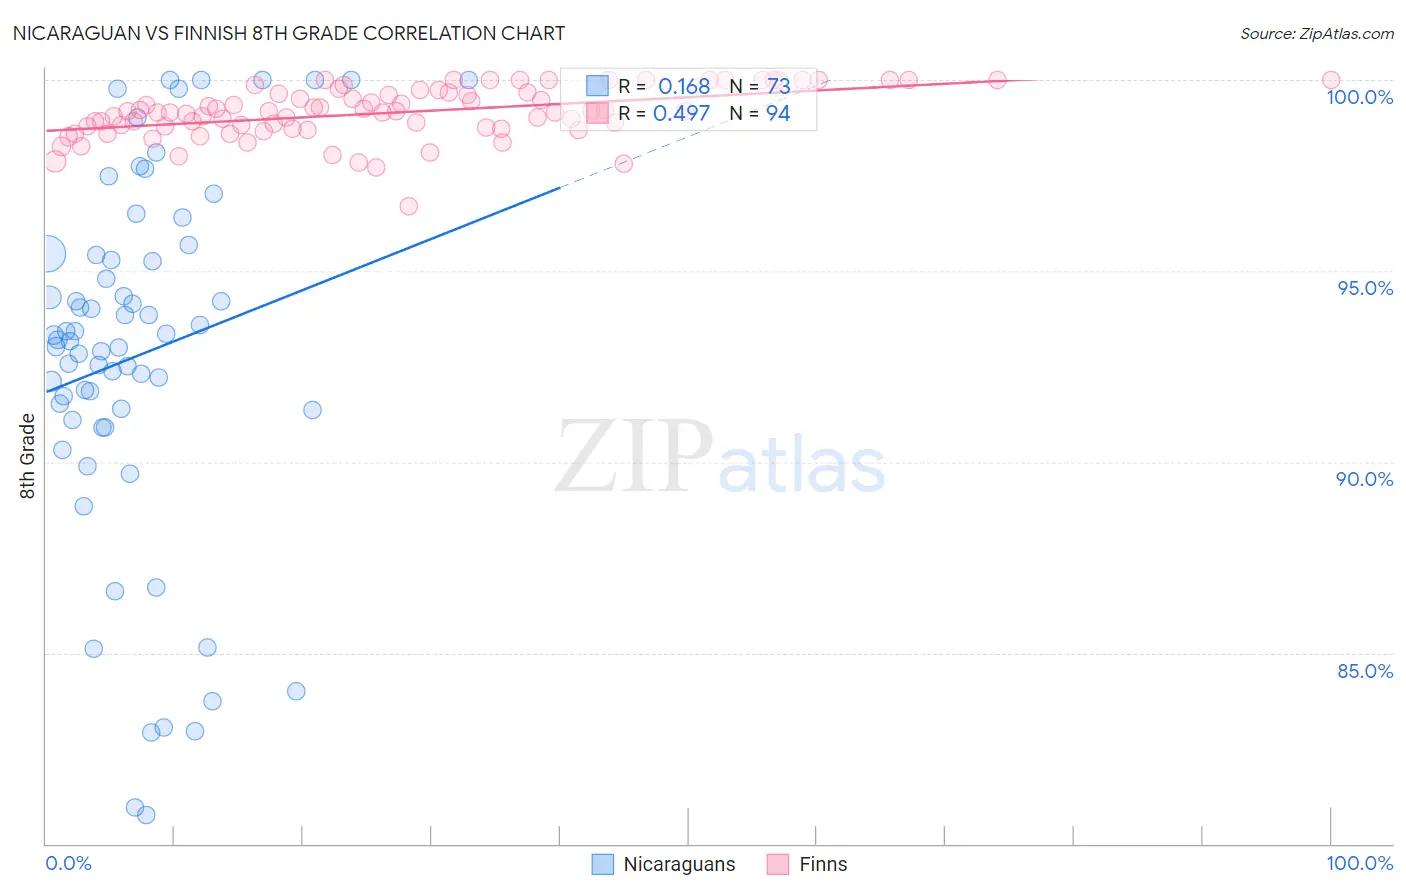
Nicaraguan vs Finnish 8th Grade Correlation Chart
The statistical analysis conducted on geographies consisting of 285,711,651 people shows a poor positive correlation between the proportion of Nicaraguans and percentage of population with at least 8th grade education in the United States with a correlation coefficient (R) of 0.168 and weighted average of 93.0%. Similarly, the statistical analysis conducted on geographies consisting of 46,910,222 people shows a moderate positive correlation between the proportion of Finns and percentage of population with at least 8th grade education in the United States with a correlation coefficient (R) of 0.497 and weighted average of 98.4%, a difference of 5.8%.
8th Grade Correlation Summary
| Measurement | Nicaraguan | Finnish |
| Minimum | 80.8% | 96.7% |
| Maximum | 100.0% | 100.0% |
| Range | 19.2% | 3.3% |
| Mean | 92.8% | 99.1% |
| Median | 93.2% | 99.2% |
| Interquartile 25% (IQ1) | 91.2% | 98.8% |
| Interquartile 75% (IQ3) | 95.4% | 99.7% |
| Interquartile Range (IQR) | 4.2% | 0.90% |
| Standard Deviation (Sample) | 4.8% | 0.67% |
| Standard Deviation (Population) | 4.7% | 0.66% |
Similar Demographics by 8th Grade
Demographics Similar to Nicaraguans by 8th Grade
In terms of 8th grade, the demographic groups most similar to Nicaraguans are Immigrants from Belize (92.9%, a difference of 0.050%), Belizean (93.1%, a difference of 0.12%), Nepalese (92.8%, a difference of 0.12%), Dominican (92.8%, a difference of 0.22%), and Immigrants from Fiji (93.2%, a difference of 0.25%).
| Demographics | Rating | Rank | 8th Grade |
| Vietnamese | 0.0 /100 | #315 | Tragic 93.5% |
| Immigrants | Cambodia | 0.0 /100 | #316 | Tragic 93.3% |
| Immigrants | Ecuador | 0.0 /100 | #317 | Tragic 93.3% |
| Puerto Ricans | 0.0 /100 | #318 | Tragic 93.2% |
| Immigrants | Cuba | 0.0 /100 | #319 | Tragic 93.2% |
| Immigrants | Fiji | 0.0 /100 | #320 | Tragic 93.2% |
| Belizeans | 0.0 /100 | #321 | Tragic 93.1% |
| Nicaraguans | 0.0 /100 | #322 | Tragic 93.0% |
| Immigrants | Belize | 0.0 /100 | #323 | Tragic 92.9% |
| Nepalese | 0.0 /100 | #324 | Tragic 92.8% |
| Dominicans | 0.0 /100 | #325 | Tragic 92.8% |
| Central American Indians | 0.0 /100 | #326 | Tragic 92.7% |
| Immigrants | Azores | 0.0 /100 | #327 | Tragic 92.5% |
| Immigrants | Nicaragua | 0.0 /100 | #328 | Tragic 92.5% |
| Immigrants | Cabo Verde | 0.0 /100 | #329 | Tragic 92.4% |
Demographics Similar to Finns by 8th Grade
In terms of 8th grade, the demographic groups most similar to Finns are Carpatho Rusyn (98.1%, a difference of 0.23%), Ottawa (97.9%, a difference of 0.43%), Tsimshian (99.0%, a difference of 0.60%), Crow (99.0%, a difference of 0.69%), and Dutch (97.7%, a difference of 0.72%).
| Demographics | Rating | Rank | 8th Grade |
| Crow | 100.0 /100 | #1 | Exceptional 99.0% |
| Tsimshian | 100.0 /100 | #2 | Exceptional 99.0% |
| Finns | 100.0 /100 | #3 | Exceptional 98.4% |
| Carpatho Rusyns | 100.0 /100 | #4 | Exceptional 98.1% |
| Ottawa | 100.0 /100 | #5 | Exceptional 97.9% |
| Dutch | 100.0 /100 | #6 | Exceptional 97.7% |
| Norwegians | 100.0 /100 | #7 | Exceptional 97.6% |
| Slovaks | 100.0 /100 | #8 | Exceptional 97.6% |
| Germans | 100.0 /100 | #9 | Exceptional 97.5% |
| Slovenes | 100.0 /100 | #10 | Exceptional 97.5% |
| Poles | 100.0 /100 | #11 | Exceptional 97.4% |
| Swedes | 100.0 /100 | #12 | Exceptional 97.4% |
| Alaskan Athabascans | 100.0 /100 | #13 | Exceptional 97.3% |
| English | 100.0 /100 | #14 | Exceptional 97.3% |
| Pennsylvania Germans | 100.0 /100 | #15 | Exceptional 97.3% |