Sri Lankan vs Finnish Median Male Earnings
COMPARE
Sri Lankan
Finnish
Median Male Earnings
Median Male Earnings Comparison
Sri Lankans
Finns
$56,136
MEDIAN MALE EARNINGS
83.4/ 100
METRIC RATING
143rd/ 347
METRIC RANK
$54,721
MEDIAN MALE EARNINGS
55.6/ 100
METRIC RATING
170th/ 347
METRIC RANK
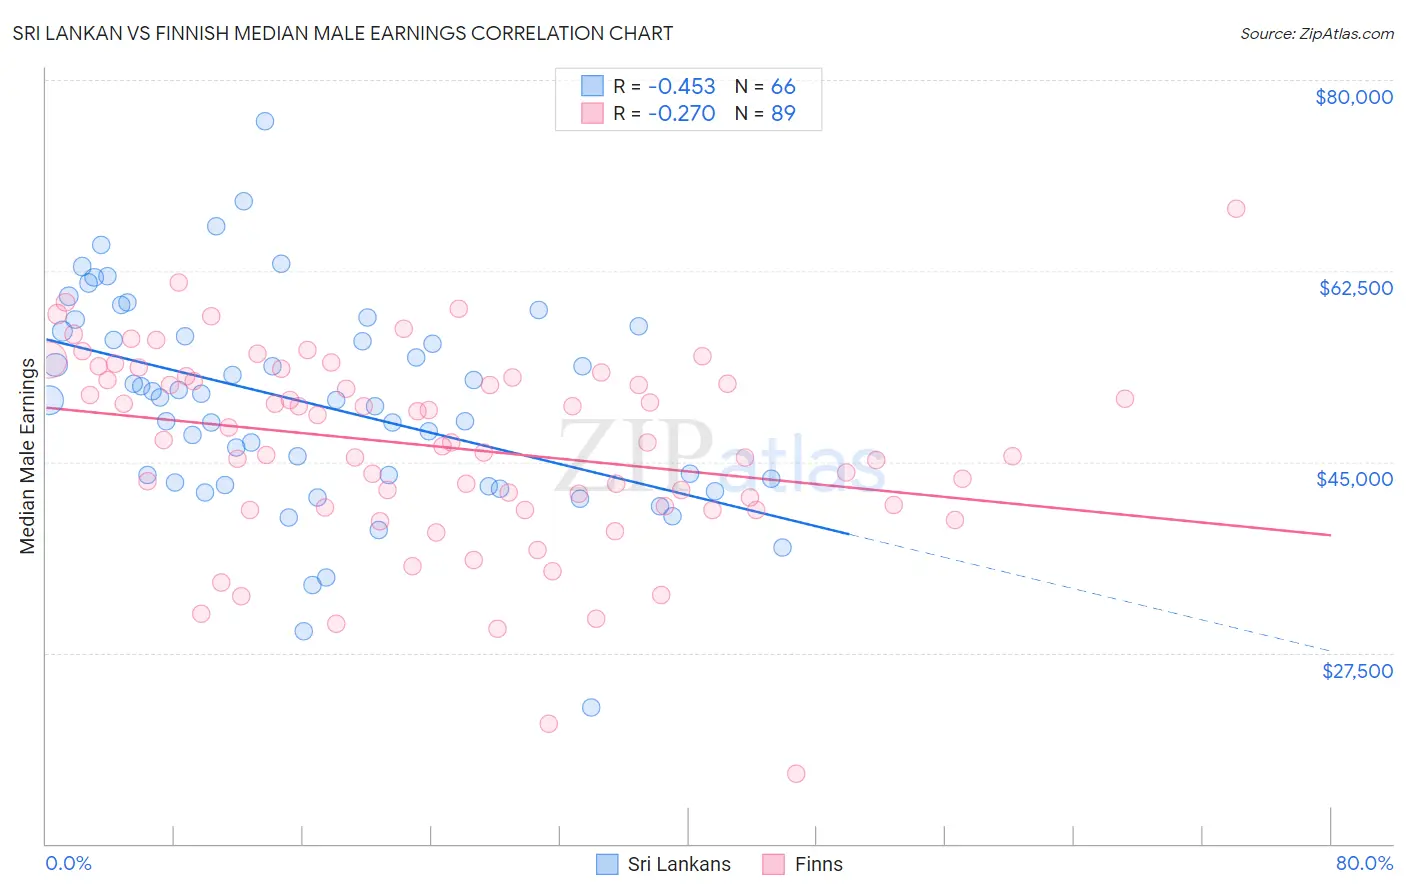
Sri Lankan vs Finnish Median Male Earnings Correlation Chart
The statistical analysis conducted on geographies consisting of 440,493,989 people shows a moderate negative correlation between the proportion of Sri Lankans and median male earnings in the United States with a correlation coefficient (R) of -0.453 and weighted average of $56,136. Similarly, the statistical analysis conducted on geographies consisting of 404,473,332 people shows a weak negative correlation between the proportion of Finns and median male earnings in the United States with a correlation coefficient (R) of -0.270 and weighted average of $54,721, a difference of 2.6%.
Median Male Earnings Correlation Summary
| Measurement | Sri Lankan | Finnish |
| Minimum | $22,532 | $16,413 |
| Maximum | $76,188 | $68,250 |
| Range | $53,656 | $51,837 |
| Mean | $50,350 | $46,398 |
| Median | $50,806 | $46,792 |
| Interquartile 25% (IQ1) | $43,067 | $40,892 |
| Interquartile 75% (IQ3) | $57,026 | $52,786 |
| Interquartile Range (IQR) | $13,959 | $11,894 |
| Standard Deviation (Sample) | $9,663 | $8,951 |
| Standard Deviation (Population) | $9,589 | $8,900 |
Similar Demographics by Median Male Earnings
Demographics Similar to Sri Lankans by Median Male Earnings
In terms of median male earnings, the demographic groups most similar to Sri Lankans are Immigrants from Uganda ($56,064, a difference of 0.13%), Danish ($56,246, a difference of 0.19%), Ethiopian ($56,243, a difference of 0.19%), Zimbabwean ($56,302, a difference of 0.29%), and Luxembourger ($56,300, a difference of 0.29%).
| Demographics | Rating | Rank | Median Male Earnings |
| Immigrants | Saudi Arabia | 87.2 /100 | #136 | Excellent $56,452 |
| Slavs | 86.5 /100 | #137 | Excellent $56,390 |
| Slovaks | 85.5 /100 | #138 | Excellent $56,306 |
| Zimbabweans | 85.5 /100 | #139 | Excellent $56,302 |
| Luxembourgers | 85.5 /100 | #140 | Excellent $56,300 |
| Danes | 84.8 /100 | #141 | Excellent $56,246 |
| Ethiopians | 84.8 /100 | #142 | Excellent $56,243 |
| Sri Lankans | 83.4 /100 | #143 | Excellent $56,136 |
| Immigrants | Uganda | 82.4 /100 | #144 | Excellent $56,064 |
| Norwegians | 80.9 /100 | #145 | Excellent $55,965 |
| Immigrants | Chile | 80.7 /100 | #146 | Excellent $55,954 |
| Immigrants | Philippines | 78.4 /100 | #147 | Good $55,809 |
| Scottish | 78.2 /100 | #148 | Good $55,793 |
| English | 77.4 /100 | #149 | Good $55,747 |
| Swiss | 77.1 /100 | #150 | Good $55,731 |
Demographics Similar to Finns by Median Male Earnings
In terms of median male earnings, the demographic groups most similar to Finns are French Canadian ($54,722, a difference of 0.0%), Immigrants from Peru ($54,695, a difference of 0.050%), Welsh ($54,647, a difference of 0.14%), Immigrants from Vietnam ($54,913, a difference of 0.35%), and South American Indian ($54,508, a difference of 0.39%).
| Demographics | Rating | Rank | Median Male Earnings |
| Ugandans | 68.6 /100 | #163 | Good $55,290 |
| Immigrants | South Eastern Asia | 67.6 /100 | #164 | Good $55,241 |
| Immigrants | Portugal | 66.3 /100 | #165 | Good $55,182 |
| Germans | 61.6 /100 | #166 | Good $54,974 |
| Immigrants | Fiji | 61.2 /100 | #167 | Good $54,958 |
| Immigrants | Vietnam | 60.2 /100 | #168 | Good $54,913 |
| French Canadians | 55.6 /100 | #169 | Average $54,722 |
| Finns | 55.6 /100 | #170 | Average $54,721 |
| Immigrants | Peru | 54.9 /100 | #171 | Average $54,695 |
| Welsh | 53.8 /100 | #172 | Average $54,647 |
| South American Indians | 50.4 /100 | #173 | Average $54,508 |
| South Americans | 50.0 /100 | #174 | Average $54,492 |
| Dutch | 48.0 /100 | #175 | Average $54,410 |
| Spaniards | 47.8 /100 | #176 | Average $54,401 |
| Costa Ricans | 44.8 /100 | #177 | Average $54,279 |