Nicaraguan vs Greek Householder Income Under 25 years
COMPARE
Nicaraguan
Greek
Householder Income Under 25 years
Householder Income Under 25 years Comparison
Nicaraguans
Greeks
$53,275
HOUSEHOLDER INCOME UNDER 25 YEARS
93.4/ 100
METRIC RATING
130th/ 347
METRIC RANK
$53,715
HOUSEHOLDER INCOME UNDER 25 YEARS
97.7/ 100
METRIC RATING
110th/ 347
METRIC RANK
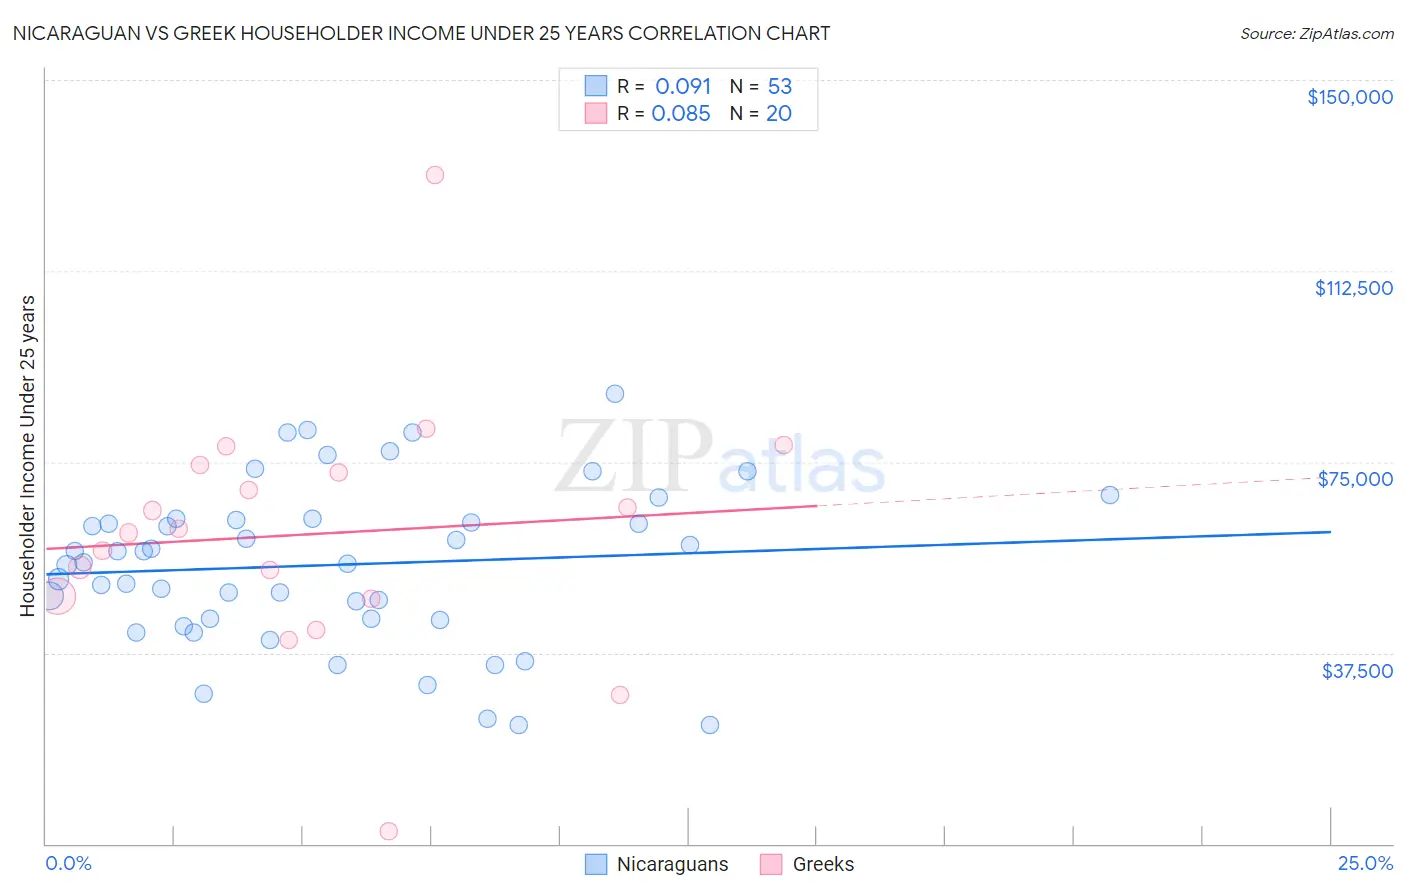
Nicaraguan vs Greek Householder Income Under 25 years Correlation Chart
The statistical analysis conducted on geographies consisting of 251,521,022 people shows a slight positive correlation between the proportion of Nicaraguans and household income with householder under the age of 25 in the United States with a correlation coefficient (R) of 0.091 and weighted average of $53,275. Similarly, the statistical analysis conducted on geographies consisting of 391,360,962 people shows a slight positive correlation between the proportion of Greeks and household income with householder under the age of 25 in the United States with a correlation coefficient (R) of 0.085 and weighted average of $53,715, a difference of 0.83%.
Householder Income Under 25 years Correlation Summary
| Measurement | Nicaraguan | Greek |
| Minimum | $23,354 | $2,499 |
| Maximum | $88,274 | $131,250 |
| Range | $64,920 | $128,751 |
| Mean | $54,761 | $60,821 |
| Median | $55,328 | $61,415 |
| Interquartile 25% (IQ1) | $44,098 | $48,366 |
| Interquartile 75% (IQ3) | $63,651 | $73,725 |
| Interquartile Range (IQR) | $19,552 | $25,359 |
| Standard Deviation (Sample) | $15,647 | $25,180 |
| Standard Deviation (Population) | $15,499 | $24,542 |
Demographics Similar to Nicaraguans and Greeks by Householder Income Under 25 years
In terms of householder income under 25 years, the demographic groups most similar to Nicaraguans are New Zealander ($53,294, a difference of 0.040%), Immigrants from North America ($53,307, a difference of 0.060%), Immigrants from Bulgaria ($53,305, a difference of 0.060%), Pakistani ($53,325, a difference of 0.090%), and Immigrants from Serbia ($53,321, a difference of 0.090%). Similarly, the demographic groups most similar to Greeks are Immigrants from Colombia ($53,714, a difference of 0.0%), Immigrants from Oceania ($53,680, a difference of 0.070%), Romanian ($53,632, a difference of 0.15%), Immigrants from Sweden ($53,621, a difference of 0.18%), and Immigrants from Albania ($53,597, a difference of 0.22%).
| Demographics | Rating | Rank | Householder Income Under 25 years |
| Greeks | 97.7 /100 | #110 | Exceptional $53,715 |
| Immigrants | Colombia | 97.7 /100 | #111 | Exceptional $53,714 |
| Immigrants | Oceania | 97.5 /100 | #112 | Exceptional $53,680 |
| Romanians | 97.2 /100 | #113 | Exceptional $53,632 |
| Immigrants | Sweden | 97.1 /100 | #114 | Exceptional $53,621 |
| Immigrants | Albania | 96.9 /100 | #115 | Exceptional $53,597 |
| Immigrants | Spain | 96.6 /100 | #116 | Exceptional $53,560 |
| Lithuanians | 96.6 /100 | #117 | Exceptional $53,552 |
| Immigrants | Switzerland | 96.3 /100 | #118 | Exceptional $53,528 |
| Italians | 95.4 /100 | #119 | Exceptional $53,426 |
| Guamanians/Chamorros | 95.3 /100 | #120 | Exceptional $53,423 |
| Immigrants | Canada | 95.2 /100 | #121 | Exceptional $53,411 |
| Immigrants | Ethiopia | 95.2 /100 | #122 | Exceptional $53,408 |
| Immigrants | Iraq | 94.9 /100 | #123 | Exceptional $53,384 |
| Colombians | 94.6 /100 | #124 | Exceptional $53,357 |
| Pakistanis | 94.1 /100 | #125 | Exceptional $53,325 |
| Immigrants | Serbia | 94.1 /100 | #126 | Exceptional $53,321 |
| Immigrants | North America | 93.9 /100 | #127 | Exceptional $53,307 |
| Immigrants | Bulgaria | 93.9 /100 | #128 | Exceptional $53,305 |
| New Zealanders | 93.7 /100 | #129 | Exceptional $53,294 |
| Nicaraguans | 93.4 /100 | #130 | Exceptional $53,275 |