Nicaraguan vs Immigrants from Kuwait Householder Income Under 25 years
COMPARE
Nicaraguan
Immigrants from Kuwait
Householder Income Under 25 years
Householder Income Under 25 years Comparison
Nicaraguans
Immigrants from Kuwait
$53,275
HOUSEHOLDER INCOME UNDER 25 YEARS
93.4/ 100
METRIC RATING
130th/ 347
METRIC RANK
$48,126
HOUSEHOLDER INCOME UNDER 25 YEARS
0.0/ 100
METRIC RATING
301st/ 347
METRIC RANK
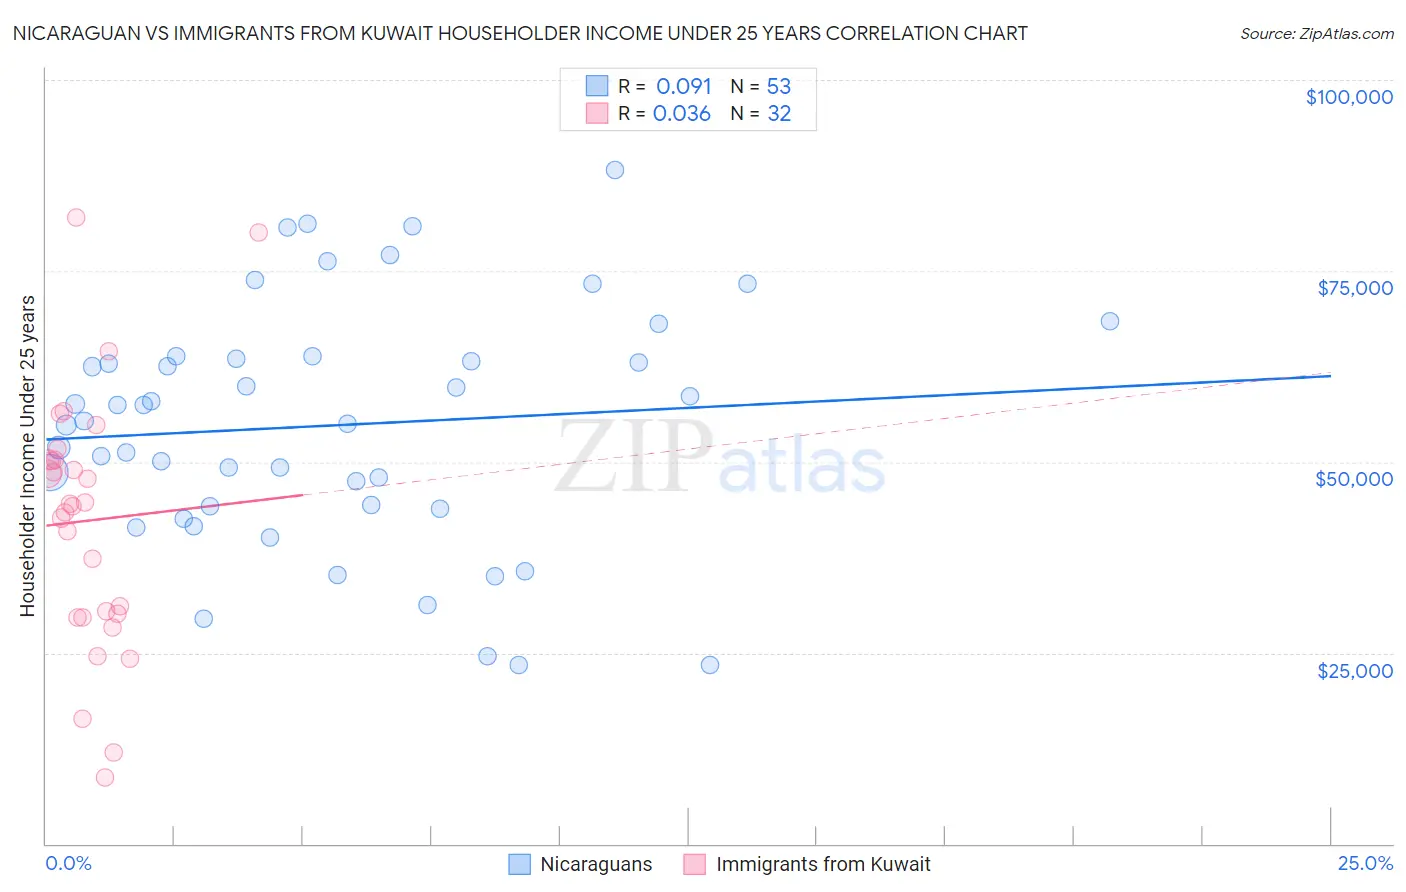
Nicaraguan vs Immigrants from Kuwait Householder Income Under 25 years Correlation Chart
The statistical analysis conducted on geographies consisting of 251,521,022 people shows a slight positive correlation between the proportion of Nicaraguans and household income with householder under the age of 25 in the United States with a correlation coefficient (R) of 0.091 and weighted average of $53,275. Similarly, the statistical analysis conducted on geographies consisting of 126,358,958 people shows no correlation between the proportion of Immigrants from Kuwait and household income with householder under the age of 25 in the United States with a correlation coefficient (R) of 0.036 and weighted average of $48,126, a difference of 10.7%.
Householder Income Under 25 years Correlation Summary
| Measurement | Nicaraguan | Immigrants from Kuwait |
| Minimum | $23,354 | $8,680 |
| Maximum | $88,274 | $81,978 |
| Range | $64,920 | $73,298 |
| Mean | $54,761 | $42,291 |
| Median | $55,328 | $44,394 |
| Interquartile 25% (IQ1) | $44,098 | $29,899 |
| Interquartile 75% (IQ3) | $63,651 | $50,227 |
| Interquartile Range (IQR) | $19,552 | $20,328 |
| Standard Deviation (Sample) | $15,647 | $16,858 |
| Standard Deviation (Population) | $15,499 | $16,592 |
Similar Demographics by Householder Income Under 25 years
Demographics Similar to Nicaraguans by Householder Income Under 25 years
In terms of householder income under 25 years, the demographic groups most similar to Nicaraguans are Immigrants from Nicaragua ($53,266, a difference of 0.020%), Moroccan ($53,256, a difference of 0.030%), New Zealander ($53,294, a difference of 0.040%), Immigrants from North America ($53,307, a difference of 0.060%), and Immigrants from Bulgaria ($53,305, a difference of 0.060%).
| Demographics | Rating | Rank | Householder Income Under 25 years |
| Immigrants | Iraq | 94.9 /100 | #123 | Exceptional $53,384 |
| Colombians | 94.6 /100 | #124 | Exceptional $53,357 |
| Pakistanis | 94.1 /100 | #125 | Exceptional $53,325 |
| Immigrants | Serbia | 94.1 /100 | #126 | Exceptional $53,321 |
| Immigrants | North America | 93.9 /100 | #127 | Exceptional $53,307 |
| Immigrants | Bulgaria | 93.9 /100 | #128 | Exceptional $53,305 |
| New Zealanders | 93.7 /100 | #129 | Exceptional $53,294 |
| Nicaraguans | 93.4 /100 | #130 | Exceptional $53,275 |
| Immigrants | Nicaragua | 93.3 /100 | #131 | Exceptional $53,266 |
| Moroccans | 93.1 /100 | #132 | Exceptional $53,256 |
| Immigrants | Immigrants | 92.2 /100 | #133 | Exceptional $53,201 |
| Immigrants | Northern Africa | 91.9 /100 | #134 | Exceptional $53,185 |
| Chileans | 91.9 /100 | #135 | Exceptional $53,185 |
| Armenians | 91.8 /100 | #136 | Exceptional $53,179 |
| Immigrants | Barbados | 91.5 /100 | #137 | Exceptional $53,163 |
Demographics Similar to Immigrants from Kuwait by Householder Income Under 25 years
In terms of householder income under 25 years, the demographic groups most similar to Immigrants from Kuwait are Immigrants from Somalia ($48,135, a difference of 0.020%), Immigrants from Honduras ($48,267, a difference of 0.29%), Immigrants from Liberia ($47,981, a difference of 0.30%), Yaqui ($48,300, a difference of 0.36%), and Immigrants from Middle Africa ($47,916, a difference of 0.44%).
| Demographics | Rating | Rank | Householder Income Under 25 years |
| Somalis | 0.0 /100 | #294 | Tragic $48,657 |
| Central American Indians | 0.0 /100 | #295 | Tragic $48,643 |
| Blackfeet | 0.0 /100 | #296 | Tragic $48,603 |
| Cree | 0.0 /100 | #297 | Tragic $48,514 |
| Yaqui | 0.0 /100 | #298 | Tragic $48,300 |
| Immigrants | Honduras | 0.0 /100 | #299 | Tragic $48,267 |
| Immigrants | Somalia | 0.0 /100 | #300 | Tragic $48,135 |
| Immigrants | Kuwait | 0.0 /100 | #301 | Tragic $48,126 |
| Immigrants | Liberia | 0.0 /100 | #302 | Tragic $47,981 |
| Immigrants | Middle Africa | 0.0 /100 | #303 | Tragic $47,916 |
| Menominee | 0.0 /100 | #304 | Tragic $47,907 |
| Cherokee | 0.0 /100 | #305 | Tragic $47,848 |
| Natives/Alaskans | 0.0 /100 | #306 | Tragic $47,704 |
| Bangladeshis | 0.0 /100 | #307 | Tragic $47,589 |
| Comanche | 0.0 /100 | #308 | Tragic $47,518 |