Cajun vs African Householder Income Under 25 years
COMPARE
Cajun
African
Householder Income Under 25 years
Householder Income Under 25 years Comparison
Cajuns
Africans
$45,338
HOUSEHOLDER INCOME UNDER 25 YEARS
0.0/ 100
METRIC RATING
334th/ 347
METRIC RANK
$46,838
HOUSEHOLDER INCOME UNDER 25 YEARS
0.0/ 100
METRIC RATING
319th/ 347
METRIC RANK
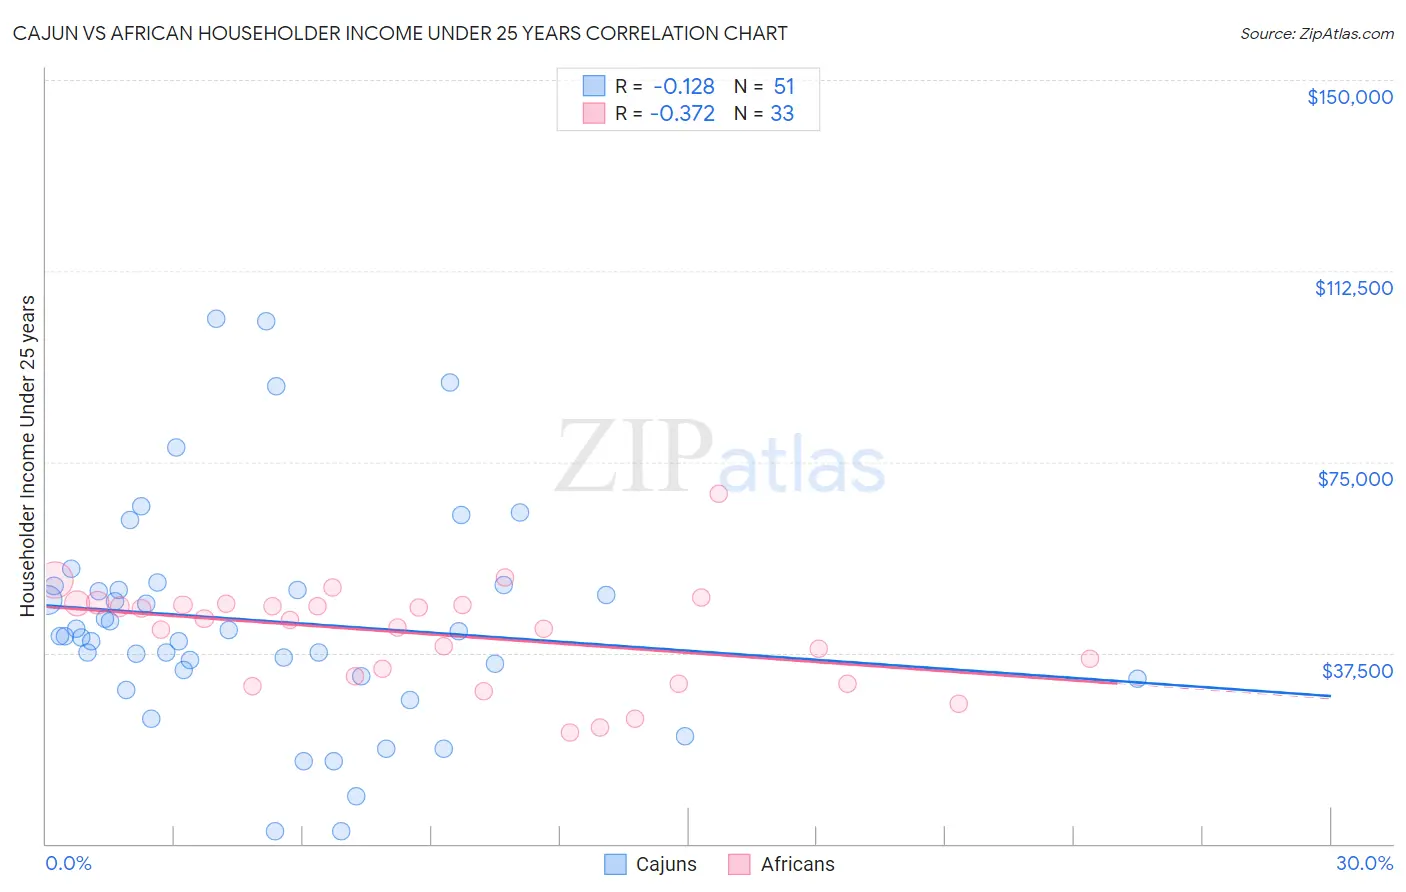
Cajun vs African Householder Income Under 25 years Correlation Chart
The statistical analysis conducted on geographies consisting of 138,130,250 people shows a poor negative correlation between the proportion of Cajuns and household income with householder under the age of 25 in the United States with a correlation coefficient (R) of -0.128 and weighted average of $45,338. Similarly, the statistical analysis conducted on geographies consisting of 392,403,445 people shows a mild negative correlation between the proportion of Africans and household income with householder under the age of 25 in the United States with a correlation coefficient (R) of -0.372 and weighted average of $46,838, a difference of 3.3%.
Householder Income Under 25 years Correlation Summary
| Measurement | Cajun | African |
| Minimum | $2,499 | $21,932 |
| Maximum | $103,125 | $68,731 |
| Range | $100,626 | $46,799 |
| Mean | $43,768 | $41,066 |
| Median | $40,772 | $43,851 |
| Interquartile 25% (IQ1) | $33,015 | $32,121 |
| Interquartile 75% (IQ3) | $50,628 | $47,071 |
| Interquartile Range (IQR) | $17,613 | $14,950 |
| Standard Deviation (Sample) | $21,959 | $10,046 |
| Standard Deviation (Population) | $21,742 | $9,893 |
Demographics Similar to Cajuns and Africans by Householder Income Under 25 years
In terms of householder income under 25 years, the demographic groups most similar to Cajuns are Creek ($45,371, a difference of 0.070%), Cheyenne ($45,275, a difference of 0.14%), Tohono O'odham ($45,248, a difference of 0.20%), Choctaw ($45,450, a difference of 0.25%), and Immigrants from Zaire ($45,529, a difference of 0.42%). Similarly, the demographic groups most similar to Africans are Immigrants from Sudan ($46,791, a difference of 0.10%), Spanish American ($46,913, a difference of 0.16%), Hopi ($46,978, a difference of 0.30%), Sudanese ($46,982, a difference of 0.31%), and Potawatomi ($46,462, a difference of 0.81%).
| Demographics | Rating | Rank | Householder Income Under 25 years |
| Sudanese | 0.0 /100 | #316 | Tragic $46,982 |
| Hopi | 0.0 /100 | #317 | Tragic $46,978 |
| Spanish Americans | 0.0 /100 | #318 | Tragic $46,913 |
| Africans | 0.0 /100 | #319 | Tragic $46,838 |
| Immigrants | Sudan | 0.0 /100 | #320 | Tragic $46,791 |
| Potawatomi | 0.0 /100 | #321 | Tragic $46,462 |
| Sioux | 0.0 /100 | #322 | Tragic $46,417 |
| Immigrants | Saudi Arabia | 0.0 /100 | #323 | Tragic $46,187 |
| Dutch West Indians | 0.0 /100 | #324 | Tragic $45,816 |
| Immigrants | Bahamas | 0.0 /100 | #325 | Tragic $45,793 |
| Osage | 0.0 /100 | #326 | Tragic $45,764 |
| Bahamians | 0.0 /100 | #327 | Tragic $45,743 |
| German Russians | 0.0 /100 | #328 | Tragic $45,673 |
| Seminole | 0.0 /100 | #329 | Tragic $45,649 |
| Indonesians | 0.0 /100 | #330 | Tragic $45,566 |
| Immigrants | Zaire | 0.0 /100 | #331 | Tragic $45,529 |
| Choctaw | 0.0 /100 | #332 | Tragic $45,450 |
| Creek | 0.0 /100 | #333 | Tragic $45,371 |
| Cajuns | 0.0 /100 | #334 | Tragic $45,338 |
| Cheyenne | 0.0 /100 | #335 | Tragic $45,275 |
| Tohono O'odham | 0.0 /100 | #336 | Tragic $45,248 |