Immigrants from Belgium vs African Householder Income Under 25 years
COMPARE
Immigrants from Belgium
African
Householder Income Under 25 years
Householder Income Under 25 years Comparison
Immigrants from Belgium
Africans
$54,830
HOUSEHOLDER INCOME UNDER 25 YEARS
99.8/ 100
METRIC RATING
63rd/ 347
METRIC RANK
$46,838
HOUSEHOLDER INCOME UNDER 25 YEARS
0.0/ 100
METRIC RATING
319th/ 347
METRIC RANK
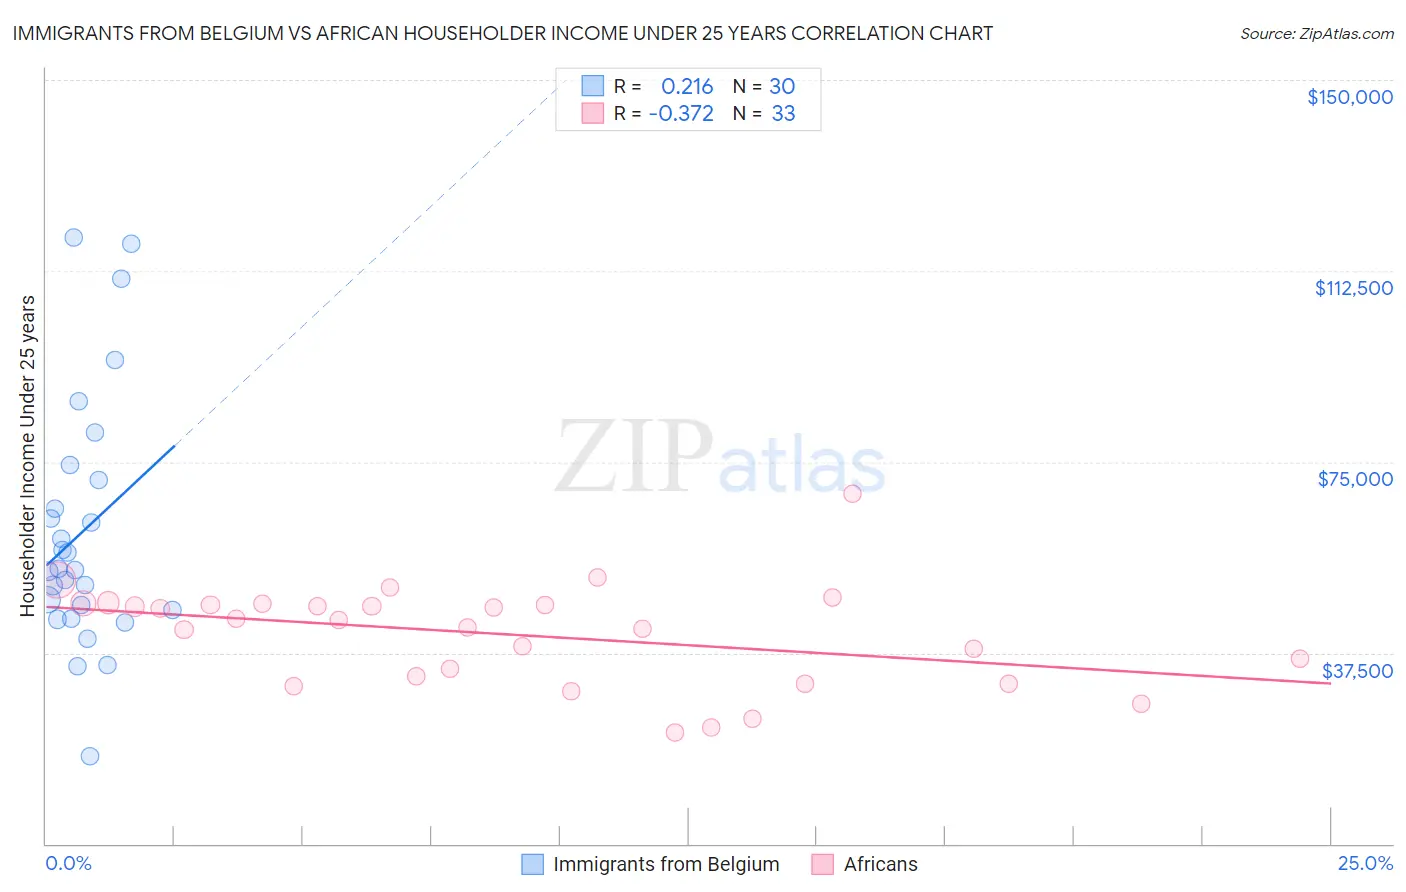
Immigrants from Belgium vs African Householder Income Under 25 years Correlation Chart
The statistical analysis conducted on geographies consisting of 131,972,517 people shows a weak positive correlation between the proportion of Immigrants from Belgium and household income with householder under the age of 25 in the United States with a correlation coefficient (R) of 0.216 and weighted average of $54,830. Similarly, the statistical analysis conducted on geographies consisting of 392,403,445 people shows a mild negative correlation between the proportion of Africans and household income with householder under the age of 25 in the United States with a correlation coefficient (R) of -0.372 and weighted average of $46,838, a difference of 17.1%.
Householder Income Under 25 years Correlation Summary
| Measurement | Immigrants from Belgium | African |
| Minimum | $17,103 | $21,932 |
| Maximum | $119,035 | $68,731 |
| Range | $101,933 | $46,799 |
| Mean | $61,275 | $41,066 |
| Median | $53,928 | $43,851 |
| Interquartile 25% (IQ1) | $46,000 | $32,121 |
| Interquartile 75% (IQ3) | $71,485 | $47,071 |
| Interquartile Range (IQR) | $25,485 | $14,950 |
| Standard Deviation (Sample) | $24,412 | $10,046 |
| Standard Deviation (Population) | $24,002 | $9,893 |
Similar Demographics by Householder Income Under 25 years
Demographics Similar to Immigrants from Belgium by Householder Income Under 25 years
In terms of householder income under 25 years, the demographic groups most similar to Immigrants from Belgium are Immigrants from Uzbekistan ($54,846, a difference of 0.030%), Burmese ($54,800, a difference of 0.060%), Yup'ik ($54,732, a difference of 0.18%), Immigrants from Bangladesh ($54,714, a difference of 0.21%), and Okinawan ($54,701, a difference of 0.24%).
| Demographics | Rating | Rank | Householder Income Under 25 years |
| Salvadorans | 100.0 /100 | #56 | Exceptional $55,412 |
| Soviet Union | 100.0 /100 | #57 | Exceptional $55,340 |
| Guyanese | 99.9 /100 | #58 | Exceptional $55,210 |
| Native Hawaiians | 99.9 /100 | #59 | Exceptional $55,158 |
| Immigrants | Lithuania | 99.9 /100 | #60 | Exceptional $55,028 |
| Immigrants | Europe | 99.9 /100 | #61 | Exceptional $55,022 |
| Immigrants | Uzbekistan | 99.8 /100 | #62 | Exceptional $54,846 |
| Immigrants | Belgium | 99.8 /100 | #63 | Exceptional $54,830 |
| Burmese | 99.8 /100 | #64 | Exceptional $54,800 |
| Yup'ik | 99.8 /100 | #65 | Exceptional $54,732 |
| Immigrants | Bangladesh | 99.8 /100 | #66 | Exceptional $54,714 |
| Okinawans | 99.8 /100 | #67 | Exceptional $54,701 |
| Tsimshian | 99.8 /100 | #68 | Exceptional $54,649 |
| Samoans | 99.7 /100 | #69 | Exceptional $54,610 |
| Immigrants | El Salvador | 99.7 /100 | #70 | Exceptional $54,599 |
Demographics Similar to Africans by Householder Income Under 25 years
In terms of householder income under 25 years, the demographic groups most similar to Africans are Immigrants from Sudan ($46,791, a difference of 0.10%), Spanish American ($46,913, a difference of 0.16%), Hopi ($46,978, a difference of 0.30%), Sudanese ($46,982, a difference of 0.31%), and Crow ($47,012, a difference of 0.37%).
| Demographics | Rating | Rank | Householder Income Under 25 years |
| Bermudans | 0.0 /100 | #312 | Tragic $47,359 |
| Delaware | 0.0 /100 | #313 | Tragic $47,159 |
| Chippewa | 0.0 /100 | #314 | Tragic $47,015 |
| Crow | 0.0 /100 | #315 | Tragic $47,012 |
| Sudanese | 0.0 /100 | #316 | Tragic $46,982 |
| Hopi | 0.0 /100 | #317 | Tragic $46,978 |
| Spanish Americans | 0.0 /100 | #318 | Tragic $46,913 |
| Africans | 0.0 /100 | #319 | Tragic $46,838 |
| Immigrants | Sudan | 0.0 /100 | #320 | Tragic $46,791 |
| Potawatomi | 0.0 /100 | #321 | Tragic $46,462 |
| Sioux | 0.0 /100 | #322 | Tragic $46,417 |
| Immigrants | Saudi Arabia | 0.0 /100 | #323 | Tragic $46,187 |
| Dutch West Indians | 0.0 /100 | #324 | Tragic $45,816 |
| Immigrants | Bahamas | 0.0 /100 | #325 | Tragic $45,793 |
| Osage | 0.0 /100 | #326 | Tragic $45,764 |