New Zealander vs Filipino Median Male Earnings
COMPARE
New Zealander
Filipino
Median Male Earnings
Median Male Earnings Comparison
New Zealanders
Filipinos
$61,199
MEDIAN MALE EARNINGS
99.9/ 100
METRIC RATING
58th/ 347
METRIC RANK
$74,224
MEDIAN MALE EARNINGS
100.0/ 100
METRIC RATING
1st/ 347
METRIC RANK
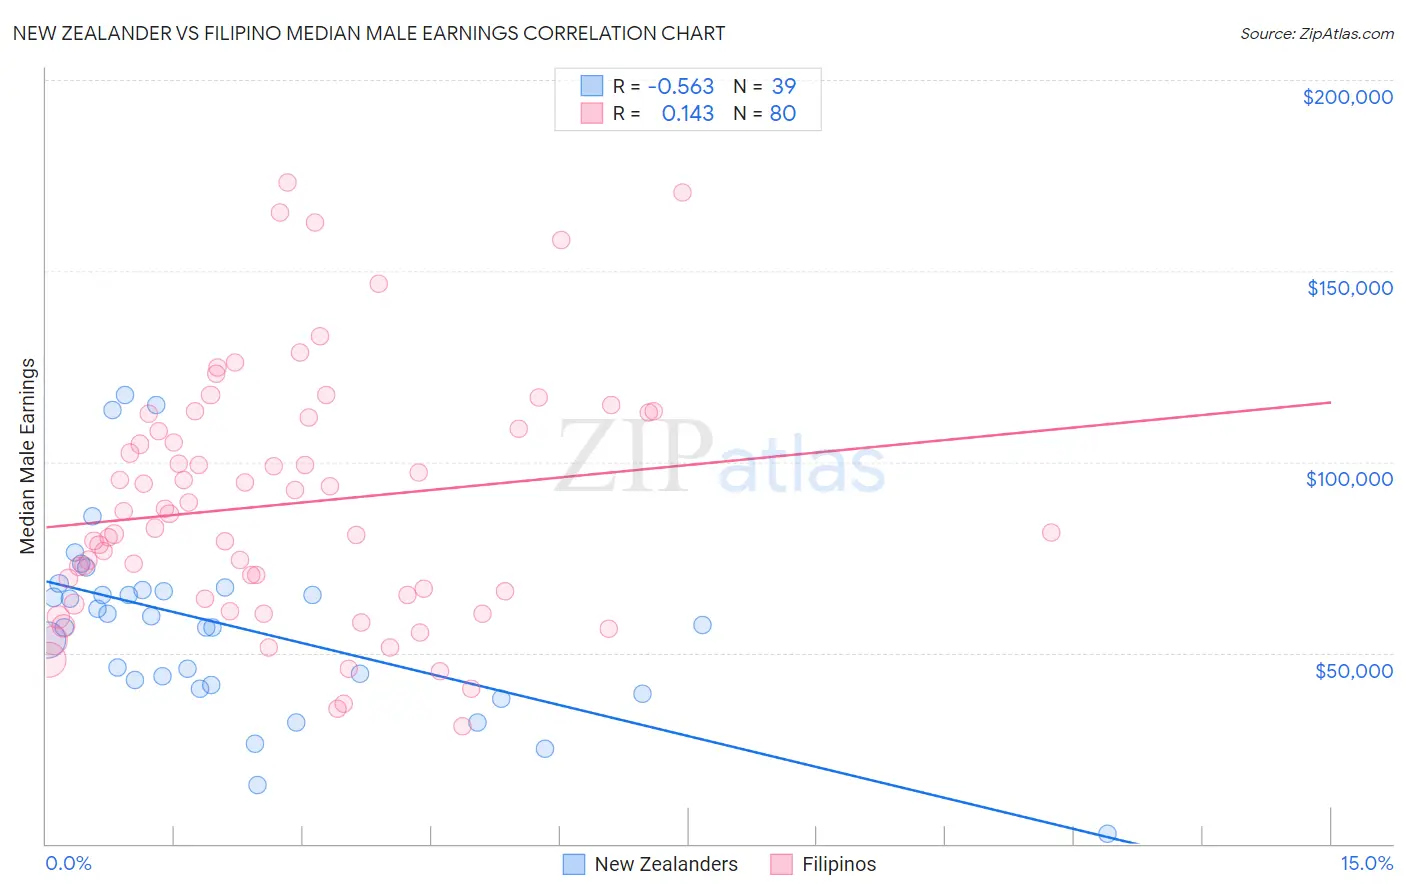
New Zealander vs Filipino Median Male Earnings Correlation Chart
The statistical analysis conducted on geographies consisting of 106,908,736 people shows a substantial negative correlation between the proportion of New Zealanders and median male earnings in the United States with a correlation coefficient (R) of -0.563 and weighted average of $61,199. Similarly, the statistical analysis conducted on geographies consisting of 254,342,119 people shows a poor positive correlation between the proportion of Filipinos and median male earnings in the United States with a correlation coefficient (R) of 0.143 and weighted average of $74,224, a difference of 21.3%.
Median Male Earnings Correlation Summary
| Measurement | New Zealander | Filipino |
| Minimum | $2,499 | $30,694 |
| Maximum | $117,445 | $173,150 |
| Range | $114,946 | $142,456 |
| Mean | $57,008 | $88,887 |
| Median | $57,308 | $84,592 |
| Interquartile 25% (IQ1) | $41,429 | $64,781 |
| Interquartile 75% (IQ3) | $66,406 | $110,251 |
| Interquartile Range (IQR) | $24,977 | $45,470 |
| Standard Deviation (Sample) | $24,372 | $32,365 |
| Standard Deviation (Population) | $24,057 | $32,162 |
Similar Demographics by Median Male Earnings
Demographics Similar to New Zealanders by Median Male Earnings
In terms of median male earnings, the demographic groups most similar to New Zealanders are Immigrants from Scotland ($61,220, a difference of 0.030%), Lithuanian ($61,228, a difference of 0.050%), Greek ($61,242, a difference of 0.070%), Immigrants from Netherlands ($61,096, a difference of 0.17%), and Egyptian ($61,095, a difference of 0.17%).
| Demographics | Rating | Rank | Median Male Earnings |
| Estonians | 99.9 /100 | #51 | Exceptional $61,710 |
| Immigrants | Norway | 99.9 /100 | #52 | Exceptional $61,628 |
| South Africans | 99.9 /100 | #53 | Exceptional $61,460 |
| Immigrants | Latvia | 99.9 /100 | #54 | Exceptional $61,422 |
| Greeks | 99.9 /100 | #55 | Exceptional $61,242 |
| Lithuanians | 99.9 /100 | #56 | Exceptional $61,228 |
| Immigrants | Scotland | 99.9 /100 | #57 | Exceptional $61,220 |
| New Zealanders | 99.9 /100 | #58 | Exceptional $61,199 |
| Immigrants | Netherlands | 99.8 /100 | #59 | Exceptional $61,096 |
| Egyptians | 99.8 /100 | #60 | Exceptional $61,095 |
| Bolivians | 99.8 /100 | #61 | Exceptional $61,066 |
| Immigrants | Romania | 99.8 /100 | #62 | Exceptional $61,040 |
| Immigrants | Pakistan | 99.8 /100 | #63 | Exceptional $60,987 |
| Immigrants | Eastern Europe | 99.8 /100 | #64 | Exceptional $60,958 |
| Immigrants | Indonesia | 99.8 /100 | #65 | Exceptional $60,935 |
Demographics Similar to Filipinos by Median Male Earnings
In terms of median male earnings, the demographic groups most similar to Filipinos are Immigrants from India ($74,207, a difference of 0.020%), Immigrants from Taiwan ($74,031, a difference of 0.26%), Thai ($72,135, a difference of 2.9%), Immigrants from Singapore ($71,348, a difference of 4.0%), and Iranian ($70,648, a difference of 5.1%).
| Demographics | Rating | Rank | Median Male Earnings |
| Filipinos | 100.0 /100 | #1 | Exceptional $74,224 |
| Immigrants | India | 100.0 /100 | #2 | Exceptional $74,207 |
| Immigrants | Taiwan | 100.0 /100 | #3 | Exceptional $74,031 |
| Thais | 100.0 /100 | #4 | Exceptional $72,135 |
| Immigrants | Singapore | 100.0 /100 | #5 | Exceptional $71,348 |
| Iranians | 100.0 /100 | #6 | Exceptional $70,648 |
| Immigrants | Hong Kong | 100.0 /100 | #7 | Exceptional $70,146 |
| Immigrants | Iran | 100.0 /100 | #8 | Exceptional $69,284 |
| Immigrants | South Central Asia | 100.0 /100 | #9 | Exceptional $68,960 |
| Immigrants | Israel | 100.0 /100 | #10 | Exceptional $68,716 |
| Immigrants | Ireland | 100.0 /100 | #11 | Exceptional $67,698 |
| Immigrants | Australia | 100.0 /100 | #12 | Exceptional $67,634 |
| Immigrants | China | 100.0 /100 | #13 | Exceptional $67,353 |
| Okinawans | 100.0 /100 | #14 | Exceptional $67,232 |
| Immigrants | Eastern Asia | 100.0 /100 | #15 | Exceptional $66,903 |