Nepalese vs Immigrants from Philippines Householder Income Ages 45 - 64 years
COMPARE
Nepalese
Immigrants from Philippines
Householder Income Ages 45 - 64 years
Householder Income Ages 45 - 64 years Comparison
Nepalese
Immigrants from Philippines
$93,355
HOUSEHOLDER INCOME AGES 45 - 64 YEARS
3.0/ 100
METRIC RATING
233rd/ 347
METRIC RANK
$108,471
HOUSEHOLDER INCOME AGES 45 - 64 YEARS
98.3/ 100
METRIC RATING
90th/ 347
METRIC RANK
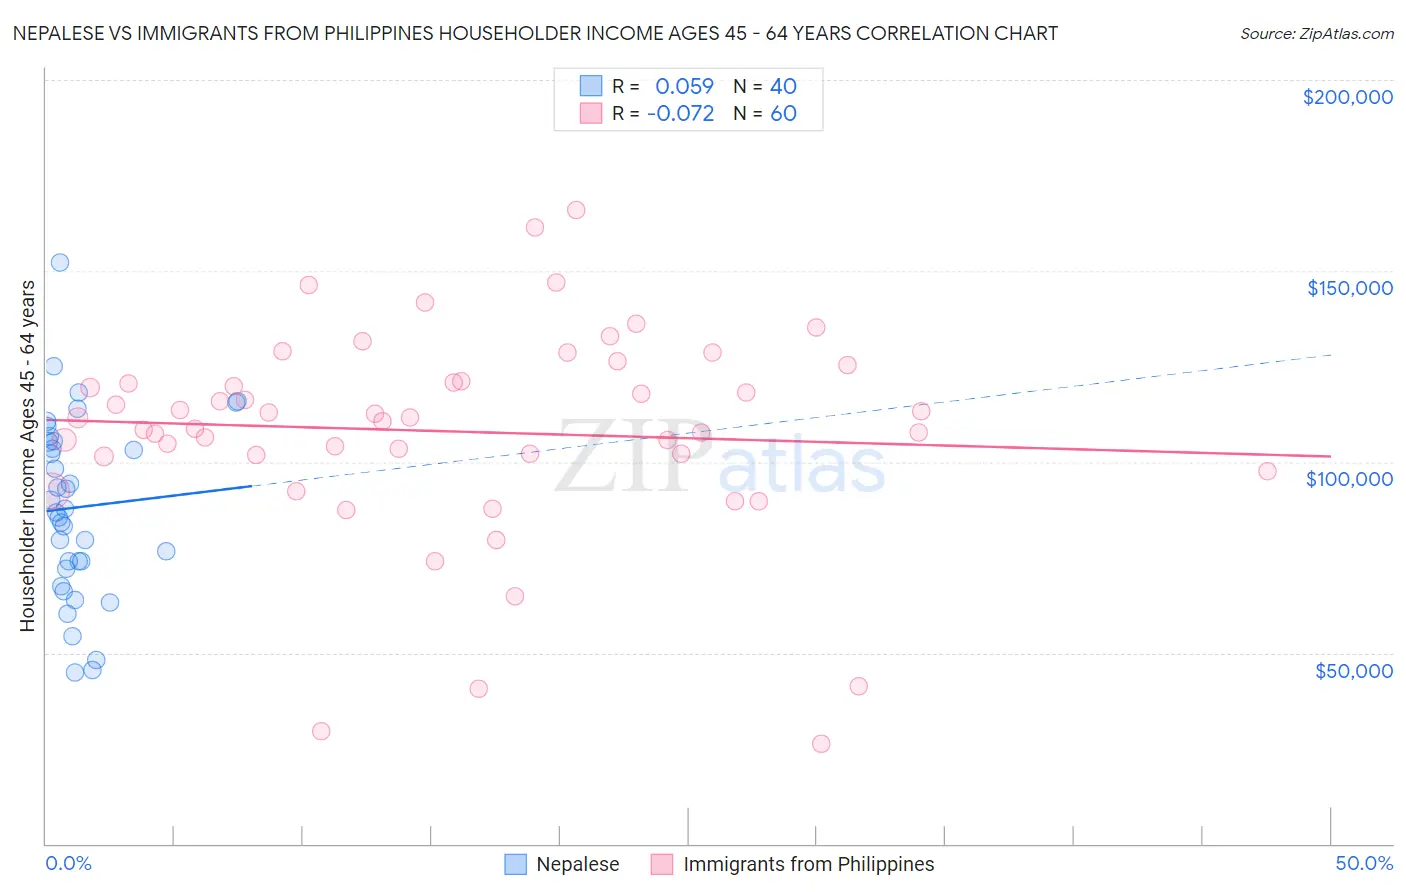
Nepalese vs Immigrants from Philippines Householder Income Ages 45 - 64 years Correlation Chart
The statistical analysis conducted on geographies consisting of 24,521,755 people shows a slight positive correlation between the proportion of Nepalese and household income with householder between the ages 45 and 64 in the United States with a correlation coefficient (R) of 0.059 and weighted average of $93,355. Similarly, the statistical analysis conducted on geographies consisting of 470,241,022 people shows a slight negative correlation between the proportion of Immigrants from Philippines and household income with householder between the ages 45 and 64 in the United States with a correlation coefficient (R) of -0.072 and weighted average of $108,471, a difference of 16.2%.
Householder Income Ages 45 - 64 years Correlation Summary
| Measurement | Nepalese | Immigrants from Philippines |
| Minimum | $44,758 | $26,250 |
| Maximum | $152,367 | $166,010 |
| Range | $107,609 | $139,760 |
| Mean | $88,143 | $107,953 |
| Median | $87,241 | $111,076 |
| Interquartile 25% (IQ1) | $72,874 | $101,597 |
| Interquartile 75% (IQ3) | $105,294 | $120,989 |
| Interquartile Range (IQR) | $32,420 | $19,391 |
| Standard Deviation (Sample) | $23,682 | $27,383 |
| Standard Deviation (Population) | $23,385 | $27,154 |
Similar Demographics by Householder Income Ages 45 - 64 years
Demographics Similar to Nepalese by Householder Income Ages 45 - 64 years
In terms of householder income ages 45 - 64 years, the demographic groups most similar to Nepalese are Immigrants from El Salvador ($93,176, a difference of 0.19%), Sudanese ($93,718, a difference of 0.39%), Ecuadorian ($93,739, a difference of 0.41%), Vietnamese ($93,788, a difference of 0.46%), and Immigrants from Sudan ($93,781, a difference of 0.46%).
| Demographics | Rating | Rank | Householder Income Ages 45 - 64 years |
| Immigrants | Azores | 4.3 /100 | #226 | Tragic $94,138 |
| Alaska Natives | 4.0 /100 | #227 | Tragic $93,991 |
| Immigrants | Panama | 3.7 /100 | #228 | Tragic $93,815 |
| Vietnamese | 3.6 /100 | #229 | Tragic $93,788 |
| Immigrants | Sudan | 3.6 /100 | #230 | Tragic $93,781 |
| Ecuadorians | 3.6 /100 | #231 | Tragic $93,739 |
| Sudanese | 3.5 /100 | #232 | Tragic $93,718 |
| Nepalese | 3.0 /100 | #233 | Tragic $93,355 |
| Immigrants | El Salvador | 2.7 /100 | #234 | Tragic $93,176 |
| Nicaraguans | 2.0 /100 | #235 | Tragic $92,554 |
| Immigrants | Western Africa | 1.8 /100 | #236 | Tragic $92,384 |
| Immigrants | Bangladesh | 1.7 /100 | #237 | Tragic $92,208 |
| Pennsylvania Germans | 1.5 /100 | #238 | Tragic $91,956 |
| Immigrants | Ecuador | 1.2 /100 | #239 | Tragic $91,462 |
| Immigrants | Burma/Myanmar | 1.1 /100 | #240 | Tragic $91,385 |
Demographics Similar to Immigrants from Philippines by Householder Income Ages 45 - 64 years
In terms of householder income ages 45 - 64 years, the demographic groups most similar to Immigrants from Philippines are Ukrainian ($108,475, a difference of 0.0%), Immigrants from Lebanon ($108,471, a difference of 0.0%), Croatian ($108,383, a difference of 0.080%), Romanian ($108,609, a difference of 0.13%), and Immigrants from Croatia ($108,304, a difference of 0.15%).
| Demographics | Rating | Rank | Householder Income Ages 45 - 64 years |
| Immigrants | Spain | 98.8 /100 | #83 | Exceptional $109,051 |
| Immigrants | Western Europe | 98.6 /100 | #84 | Exceptional $108,824 |
| Immigrants | Afghanistan | 98.6 /100 | #85 | Exceptional $108,785 |
| Austrians | 98.5 /100 | #86 | Exceptional $108,692 |
| Tongans | 98.5 /100 | #87 | Exceptional $108,643 |
| Romanians | 98.5 /100 | #88 | Exceptional $108,609 |
| Ukrainians | 98.3 /100 | #89 | Exceptional $108,475 |
| Immigrants | Philippines | 98.3 /100 | #90 | Exceptional $108,471 |
| Immigrants | Lebanon | 98.3 /100 | #91 | Exceptional $108,471 |
| Croatians | 98.3 /100 | #92 | Exceptional $108,383 |
| Immigrants | Croatia | 98.2 /100 | #93 | Exceptional $108,304 |
| Sri Lankans | 98.2 /100 | #94 | Exceptional $108,270 |
| Immigrants | Hungary | 98.2 /100 | #95 | Exceptional $108,267 |
| Immigrants | Argentina | 98.2 /100 | #96 | Exceptional $108,264 |
| Northern Europeans | 97.8 /100 | #97 | Exceptional $107,870 |