Nepalese vs Immigrants from Northern Africa Householder Income Ages 45 - 64 years
COMPARE
Nepalese
Immigrants from Northern Africa
Householder Income Ages 45 - 64 years
Householder Income Ages 45 - 64 years Comparison
Nepalese
Immigrants from Northern Africa
$93,355
HOUSEHOLDER INCOME AGES 45 - 64 YEARS
3.0/ 100
METRIC RATING
233rd/ 347
METRIC RANK
$105,430
HOUSEHOLDER INCOME AGES 45 - 64 YEARS
92.8/ 100
METRIC RATING
124th/ 347
METRIC RANK
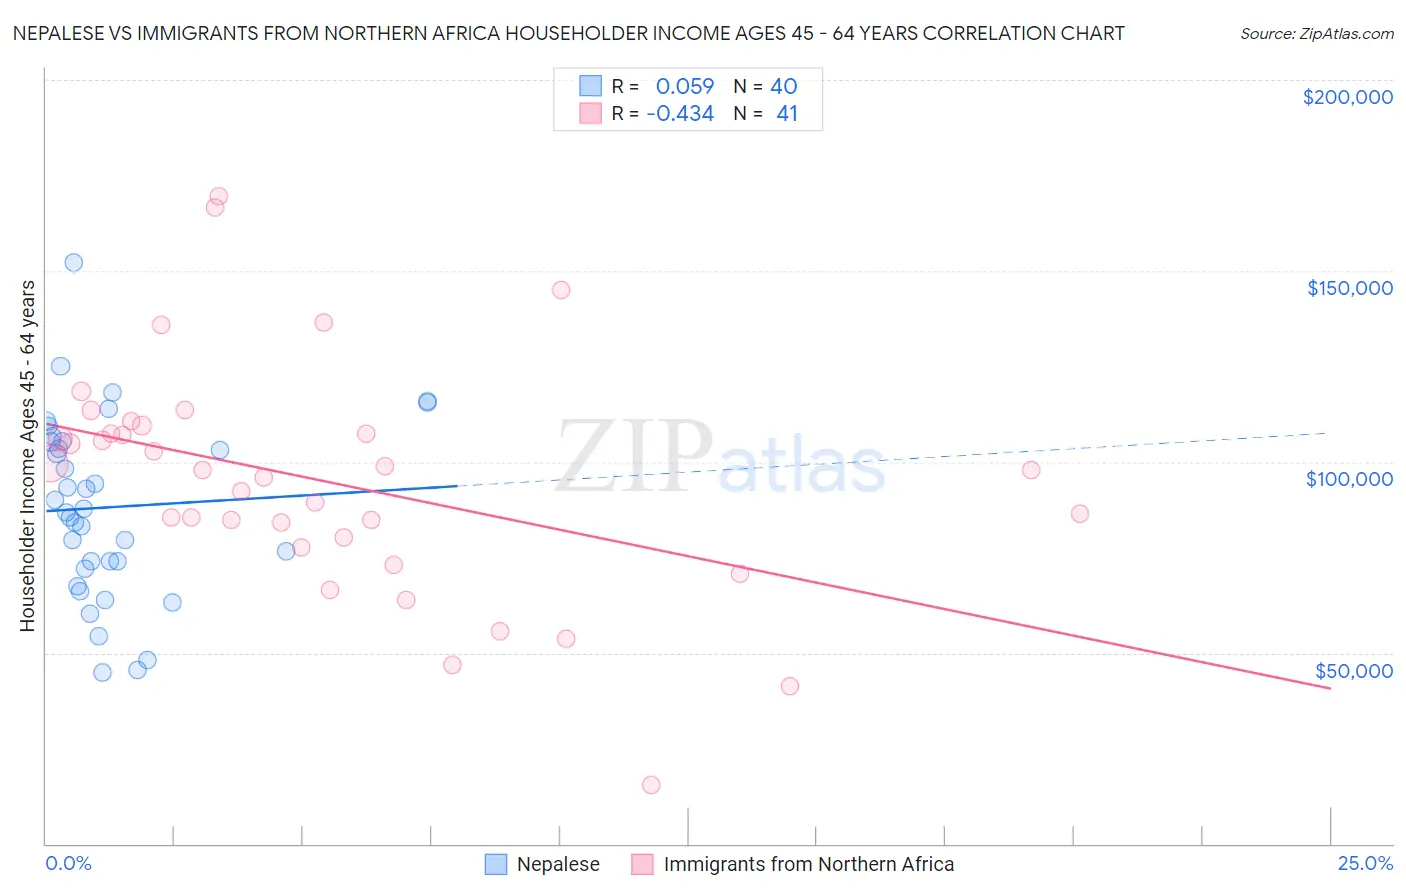
Nepalese vs Immigrants from Northern Africa Householder Income Ages 45 - 64 years Correlation Chart
The statistical analysis conducted on geographies consisting of 24,521,755 people shows a slight positive correlation between the proportion of Nepalese and household income with householder between the ages 45 and 64 in the United States with a correlation coefficient (R) of 0.059 and weighted average of $93,355. Similarly, the statistical analysis conducted on geographies consisting of 320,874,283 people shows a moderate negative correlation between the proportion of Immigrants from Northern Africa and household income with householder between the ages 45 and 64 in the United States with a correlation coefficient (R) of -0.434 and weighted average of $105,430, a difference of 12.9%.
Householder Income Ages 45 - 64 years Correlation Summary
| Measurement | Nepalese | Immigrants from Northern Africa |
| Minimum | $44,758 | $15,339 |
| Maximum | $152,367 | $169,416 |
| Range | $107,609 | $154,077 |
| Mean | $88,143 | $94,832 |
| Median | $87,241 | $97,957 |
| Interquartile 25% (IQ1) | $72,874 | $78,949 |
| Interquartile 75% (IQ3) | $105,294 | $108,413 |
| Interquartile Range (IQR) | $32,420 | $29,464 |
| Standard Deviation (Sample) | $23,682 | $30,815 |
| Standard Deviation (Population) | $23,385 | $30,437 |
Similar Demographics by Householder Income Ages 45 - 64 years
Demographics Similar to Nepalese by Householder Income Ages 45 - 64 years
In terms of householder income ages 45 - 64 years, the demographic groups most similar to Nepalese are Immigrants from El Salvador ($93,176, a difference of 0.19%), Sudanese ($93,718, a difference of 0.39%), Ecuadorian ($93,739, a difference of 0.41%), Vietnamese ($93,788, a difference of 0.46%), and Immigrants from Sudan ($93,781, a difference of 0.46%).
| Demographics | Rating | Rank | Householder Income Ages 45 - 64 years |
| Immigrants | Azores | 4.3 /100 | #226 | Tragic $94,138 |
| Alaska Natives | 4.0 /100 | #227 | Tragic $93,991 |
| Immigrants | Panama | 3.7 /100 | #228 | Tragic $93,815 |
| Vietnamese | 3.6 /100 | #229 | Tragic $93,788 |
| Immigrants | Sudan | 3.6 /100 | #230 | Tragic $93,781 |
| Ecuadorians | 3.6 /100 | #231 | Tragic $93,739 |
| Sudanese | 3.5 /100 | #232 | Tragic $93,718 |
| Nepalese | 3.0 /100 | #233 | Tragic $93,355 |
| Immigrants | El Salvador | 2.7 /100 | #234 | Tragic $93,176 |
| Nicaraguans | 2.0 /100 | #235 | Tragic $92,554 |
| Immigrants | Western Africa | 1.8 /100 | #236 | Tragic $92,384 |
| Immigrants | Bangladesh | 1.7 /100 | #237 | Tragic $92,208 |
| Pennsylvania Germans | 1.5 /100 | #238 | Tragic $91,956 |
| Immigrants | Ecuador | 1.2 /100 | #239 | Tragic $91,462 |
| Immigrants | Burma/Myanmar | 1.1 /100 | #240 | Tragic $91,385 |
Demographics Similar to Immigrants from Northern Africa by Householder Income Ages 45 - 64 years
In terms of householder income ages 45 - 64 years, the demographic groups most similar to Immigrants from Northern Africa are Pakistani ($105,317, a difference of 0.11%), Portuguese ($105,309, a difference of 0.12%), Immigrants from Saudi Arabia ($105,249, a difference of 0.17%), Danish ($105,619, a difference of 0.18%), and Native Hawaiian ($105,149, a difference of 0.27%).
| Demographics | Rating | Rank | Householder Income Ages 45 - 64 years |
| Albanians | 95.1 /100 | #117 | Exceptional $106,243 |
| Immigrants | Western Asia | 95.0 /100 | #118 | Exceptional $106,217 |
| Immigrants | Jordan | 94.9 /100 | #119 | Exceptional $106,164 |
| Immigrants | South Eastern Asia | 94.8 /100 | #120 | Exceptional $106,109 |
| Poles | 94.4 /100 | #121 | Exceptional $105,952 |
| Immigrants | North Macedonia | 94.2 /100 | #122 | Exceptional $105,892 |
| Danes | 93.4 /100 | #123 | Exceptional $105,619 |
| Immigrants | Northern Africa | 92.8 /100 | #124 | Exceptional $105,430 |
| Pakistanis | 92.4 /100 | #125 | Exceptional $105,317 |
| Portuguese | 92.4 /100 | #126 | Exceptional $105,309 |
| Immigrants | Saudi Arabia | 92.2 /100 | #127 | Exceptional $105,249 |
| Native Hawaiians | 91.8 /100 | #128 | Exceptional $105,149 |
| Peruvians | 91.5 /100 | #129 | Exceptional $105,070 |
| Immigrants | Zimbabwe | 91.2 /100 | #130 | Exceptional $104,992 |
| Immigrants | Syria | 90.7 /100 | #131 | Exceptional $104,858 |