Nepalese vs Immigrants from Philippines 8th Grade
COMPARE
Nepalese
Immigrants from Philippines
8th Grade
8th Grade Comparison
Nepalese
Immigrants from Philippines
92.8%
8TH GRADE
0.0/ 100
METRIC RATING
324th/ 347
METRIC RANK
94.6%
8TH GRADE
0.1/ 100
METRIC RATING
284th/ 347
METRIC RANK
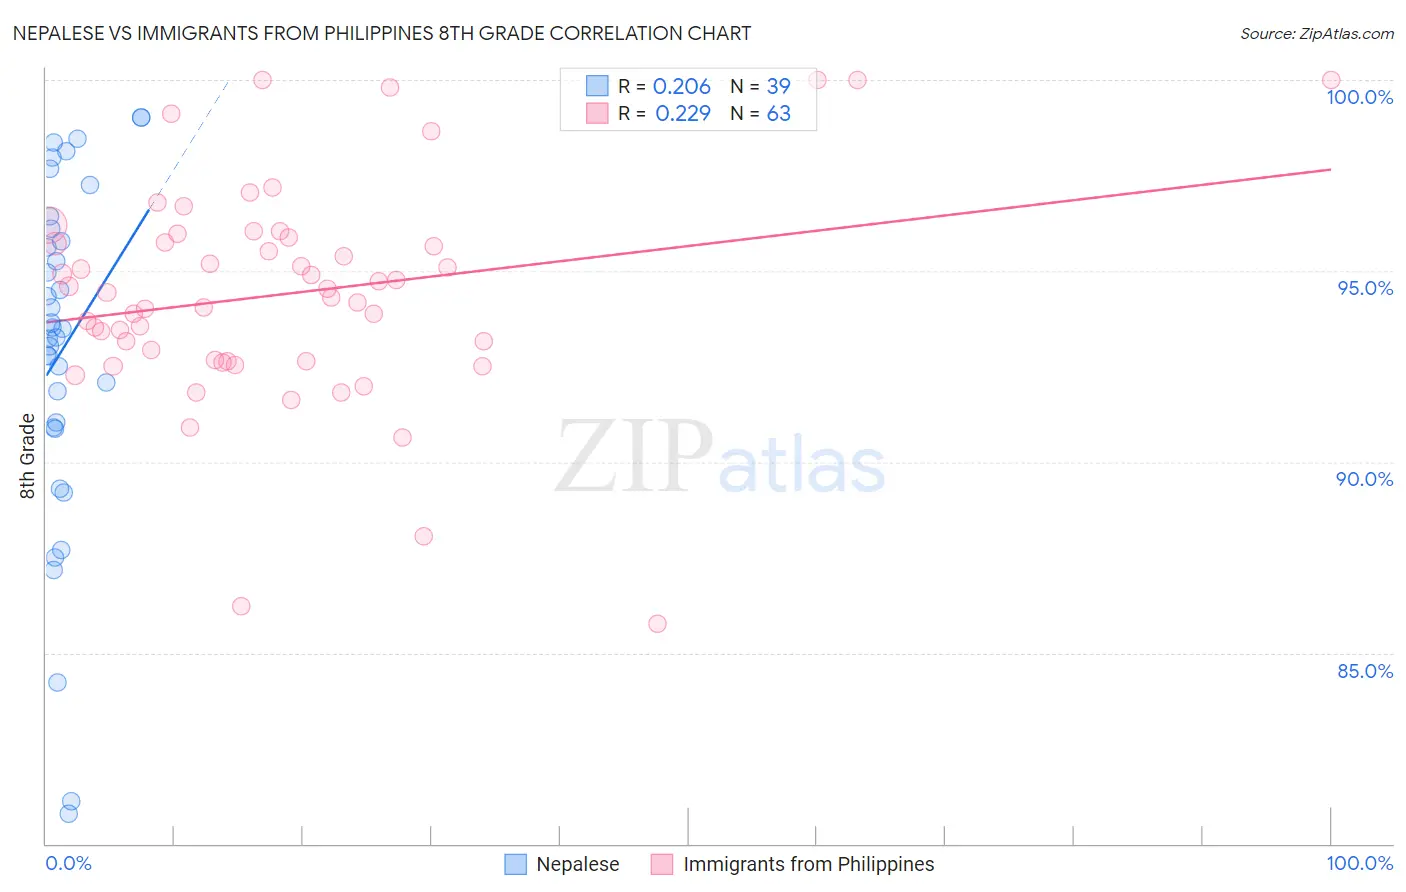
Nepalese vs Immigrants from Philippines 8th Grade Correlation Chart
The statistical analysis conducted on geographies consisting of 24,519,269 people shows a weak positive correlation between the proportion of Nepalese and percentage of population with at least 8th grade education in the United States with a correlation coefficient (R) of 0.206 and weighted average of 92.8%. Similarly, the statistical analysis conducted on geographies consisting of 471,300,535 people shows a weak positive correlation between the proportion of Immigrants from Philippines and percentage of population with at least 8th grade education in the United States with a correlation coefficient (R) of 0.229 and weighted average of 94.6%, a difference of 1.8%.
8th Grade Correlation Summary
| Measurement | Nepalese | Immigrants from Philippines |
| Minimum | 80.8% | 85.8% |
| Maximum | 99.0% | 100.0% |
| Range | 18.2% | 14.2% |
| Mean | 92.9% | 94.4% |
| Median | 93.5% | 94.4% |
| Interquartile 25% (IQ1) | 90.9% | 92.6% |
| Interquartile 75% (IQ3) | 96.1% | 95.9% |
| Interquartile Range (IQR) | 5.2% | 3.3% |
| Standard Deviation (Sample) | 4.5% | 2.9% |
| Standard Deviation (Population) | 4.5% | 2.9% |
Similar Demographics by 8th Grade
Demographics Similar to Nepalese by 8th Grade
In terms of 8th grade, the demographic groups most similar to Nepalese are Immigrants from Belize (92.9%, a difference of 0.070%), Dominican (92.8%, a difference of 0.090%), Nicaraguan (93.0%, a difference of 0.12%), Central American Indian (92.7%, a difference of 0.14%), and Belizean (93.1%, a difference of 0.24%).
| Demographics | Rating | Rank | 8th Grade |
| Immigrants | Ecuador | 0.0 /100 | #317 | Tragic 93.3% |
| Puerto Ricans | 0.0 /100 | #318 | Tragic 93.2% |
| Immigrants | Cuba | 0.0 /100 | #319 | Tragic 93.2% |
| Immigrants | Fiji | 0.0 /100 | #320 | Tragic 93.2% |
| Belizeans | 0.0 /100 | #321 | Tragic 93.1% |
| Nicaraguans | 0.0 /100 | #322 | Tragic 93.0% |
| Immigrants | Belize | 0.0 /100 | #323 | Tragic 92.9% |
| Nepalese | 0.0 /100 | #324 | Tragic 92.8% |
| Dominicans | 0.0 /100 | #325 | Tragic 92.8% |
| Central American Indians | 0.0 /100 | #326 | Tragic 92.7% |
| Immigrants | Azores | 0.0 /100 | #327 | Tragic 92.5% |
| Immigrants | Nicaragua | 0.0 /100 | #328 | Tragic 92.5% |
| Immigrants | Cabo Verde | 0.0 /100 | #329 | Tragic 92.4% |
| Immigrants | Armenia | 0.0 /100 | #330 | Tragic 92.3% |
| Hondurans | 0.0 /100 | #331 | Tragic 92.3% |
Demographics Similar to Immigrants from Philippines by 8th Grade
In terms of 8th grade, the demographic groups most similar to Immigrants from Philippines are Immigrants from St. Vincent and the Grenadines (94.6%, a difference of 0.010%), Immigrants from Barbados (94.5%, a difference of 0.030%), Immigrants from Eritrea (94.6%, a difference of 0.040%), Immigrants from Bolivia (94.6%, a difference of 0.080%), and Immigrants from Peru (94.5%, a difference of 0.080%).
| Demographics | Rating | Rank | 8th Grade |
| Taiwanese | 0.1 /100 | #277 | Tragic 94.7% |
| Armenians | 0.1 /100 | #278 | Tragic 94.7% |
| Immigrants | Trinidad and Tobago | 0.1 /100 | #279 | Tragic 94.6% |
| Barbadians | 0.1 /100 | #280 | Tragic 94.6% |
| Immigrants | Bolivia | 0.1 /100 | #281 | Tragic 94.6% |
| Immigrants | Eritrea | 0.1 /100 | #282 | Tragic 94.6% |
| Immigrants | St. Vincent and the Grenadines | 0.1 /100 | #283 | Tragic 94.6% |
| Immigrants | Philippines | 0.1 /100 | #284 | Tragic 94.6% |
| Immigrants | Barbados | 0.0 /100 | #285 | Tragic 94.5% |
| Immigrants | Peru | 0.0 /100 | #286 | Tragic 94.5% |
| Tohono O'odham | 0.0 /100 | #287 | Tragic 94.5% |
| Malaysians | 0.0 /100 | #288 | Tragic 94.5% |
| British West Indians | 0.0 /100 | #289 | Tragic 94.4% |
| Immigrants | West Indies | 0.0 /100 | #290 | Tragic 94.3% |
| Immigrants | Grenada | 0.0 /100 | #291 | Tragic 94.3% |