Nepalese vs Immigrants from Philippines In Labor Force | Age 35-44
COMPARE
Nepalese
Immigrants from Philippines
In Labor Force | Age 35-44
In Labor Force | Age 35-44 Comparison
Nepalese
Immigrants from Philippines
82.4%
IN LABOR FORCE | AGE 35-44
0.0/ 100
METRIC RATING
303rd/ 347
METRIC RANK
84.2%
IN LABOR FORCE | AGE 35-44
27.9/ 100
METRIC RATING
191st/ 347
METRIC RANK
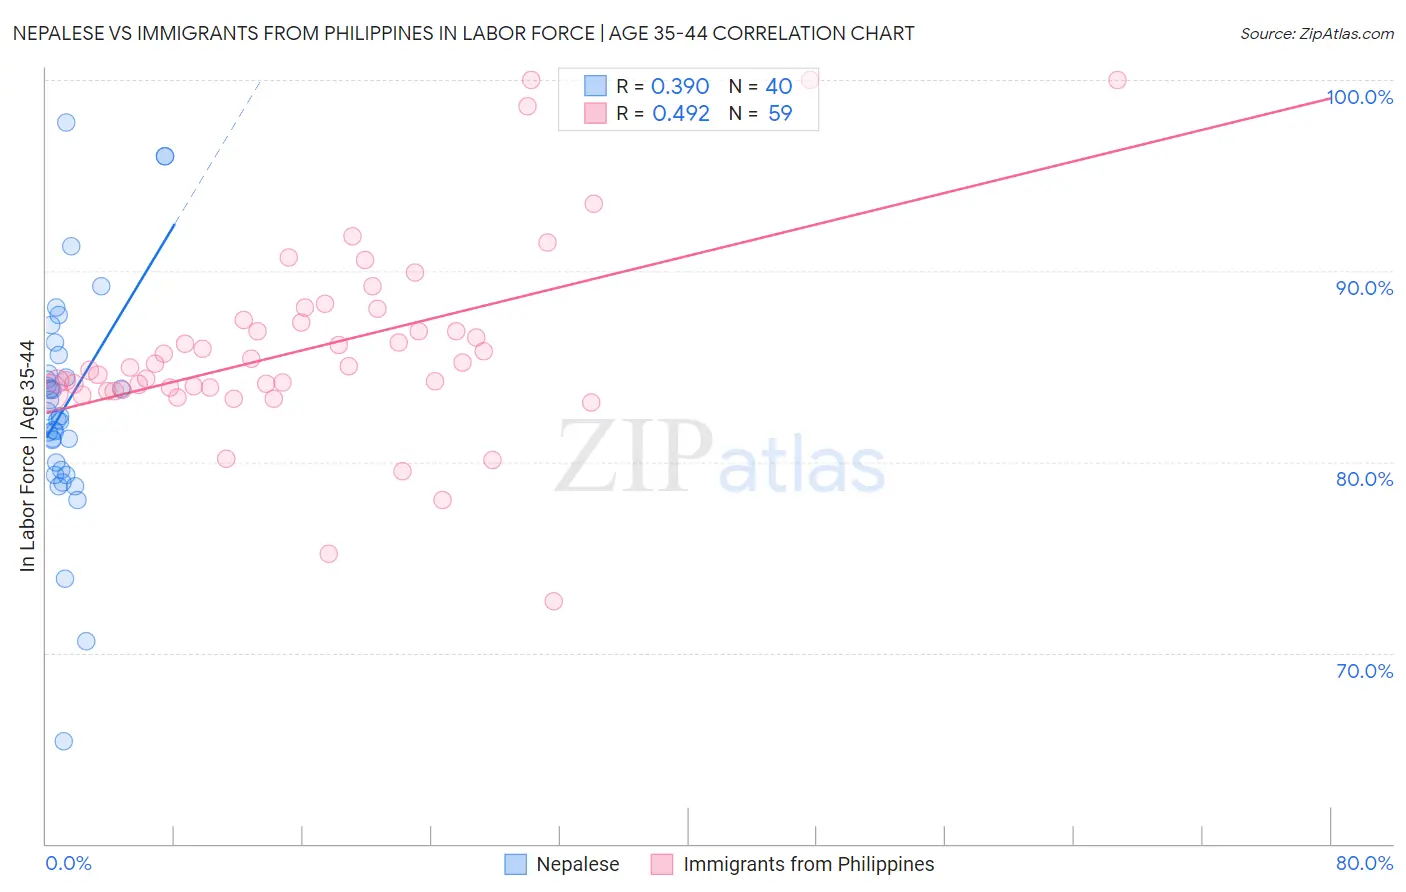
Nepalese vs Immigrants from Philippines In Labor Force | Age 35-44 Correlation Chart
The statistical analysis conducted on geographies consisting of 24,521,755 people shows a mild positive correlation between the proportion of Nepalese and labor force participation rate among population between the ages 35 and 44 in the United States with a correlation coefficient (R) of 0.390 and weighted average of 82.4%. Similarly, the statistical analysis conducted on geographies consisting of 471,128,503 people shows a moderate positive correlation between the proportion of Immigrants from Philippines and labor force participation rate among population between the ages 35 and 44 in the United States with a correlation coefficient (R) of 0.492 and weighted average of 84.2%, a difference of 2.2%.
In Labor Force | Age 35-44 Correlation Summary
| Measurement | Nepalese | Immigrants from Philippines |
| Minimum | 65.4% | 72.7% |
| Maximum | 97.8% | 100.0% |
| Range | 32.4% | 27.3% |
| Mean | 83.0% | 86.0% |
| Median | 82.5% | 85.0% |
| Interquartile 25% (IQ1) | 79.8% | 83.8% |
| Interquartile 75% (IQ3) | 85.1% | 87.4% |
| Interquartile Range (IQR) | 5.3% | 3.6% |
| Standard Deviation (Sample) | 6.1% | 5.1% |
| Standard Deviation (Population) | 6.0% | 5.1% |
Similar Demographics by In Labor Force | Age 35-44
Demographics Similar to Nepalese by In Labor Force | Age 35-44
In terms of in labor force | age 35-44, the demographic groups most similar to Nepalese are American (82.4%, a difference of 0.0%), Marshallese (82.4%, a difference of 0.010%), Spanish American Indian (82.5%, a difference of 0.080%), Central American Indian (82.5%, a difference of 0.10%), and Tlingit-Haida (82.5%, a difference of 0.16%).
| Demographics | Rating | Rank | In Labor Force | Age 35-44 |
| Mexican American Indians | 0.0 /100 | #296 | Tragic 82.6% |
| Hmong | 0.0 /100 | #297 | Tragic 82.6% |
| Ottawa | 0.0 /100 | #298 | Tragic 82.6% |
| Tlingit-Haida | 0.0 /100 | #299 | Tragic 82.5% |
| Central American Indians | 0.0 /100 | #300 | Tragic 82.5% |
| Spanish American Indians | 0.0 /100 | #301 | Tragic 82.5% |
| Americans | 0.0 /100 | #302 | Tragic 82.4% |
| Nepalese | 0.0 /100 | #303 | Tragic 82.4% |
| Marshallese | 0.0 /100 | #304 | Tragic 82.4% |
| Shoshone | 0.0 /100 | #305 | Tragic 82.2% |
| Blacks/African Americans | 0.0 /100 | #306 | Tragic 82.2% |
| Hispanics or Latinos | 0.0 /100 | #307 | Tragic 82.1% |
| Immigrants | Central America | 0.0 /100 | #308 | Tragic 82.0% |
| Cree | 0.0 /100 | #309 | Tragic 82.0% |
| Blackfeet | 0.0 /100 | #310 | Tragic 81.9% |
Demographics Similar to Immigrants from Philippines by In Labor Force | Age 35-44
In terms of in labor force | age 35-44, the demographic groups most similar to Immigrants from Philippines are Immigrants from Vietnam (84.2%, a difference of 0.0%), Hungarian (84.2%, a difference of 0.010%), Immigrants from Indonesia (84.2%, a difference of 0.020%), Immigrants from Caribbean (84.2%, a difference of 0.020%), and Immigrants from England (84.2%, a difference of 0.020%).
| Demographics | Rating | Rank | In Labor Force | Age 35-44 |
| Armenians | 35.6 /100 | #184 | Fair 84.3% |
| Costa Ricans | 35.3 /100 | #185 | Fair 84.3% |
| Australians | 35.1 /100 | #186 | Fair 84.3% |
| Dutch | 34.8 /100 | #187 | Fair 84.3% |
| South Africans | 34.1 /100 | #188 | Fair 84.3% |
| Immigrants | Denmark | 33.7 /100 | #189 | Fair 84.3% |
| Portuguese | 31.9 /100 | #190 | Fair 84.3% |
| Immigrants | Philippines | 27.9 /100 | #191 | Fair 84.2% |
| Immigrants | Vietnam | 27.4 /100 | #192 | Fair 84.2% |
| Hungarians | 26.8 /100 | #193 | Fair 84.2% |
| Immigrants | Indonesia | 25.7 /100 | #194 | Fair 84.2% |
| Immigrants | Caribbean | 25.7 /100 | #195 | Fair 84.2% |
| Immigrants | England | 25.0 /100 | #196 | Fair 84.2% |
| Immigrants | Western Europe | 24.7 /100 | #197 | Fair 84.2% |
| Ecuadorians | 24.0 /100 | #198 | Fair 84.2% |