Mongolian vs Maltese Median Family Income
COMPARE
Mongolian
Maltese
Median Family Income
Median Family Income Comparison
Mongolians
Maltese
$114,553
MEDIAN FAMILY INCOME
99.8/ 100
METRIC RATING
62nd/ 347
METRIC RANK
$115,862
MEDIAN FAMILY INCOME
99.9/ 100
METRIC RATING
52nd/ 347
METRIC RANK
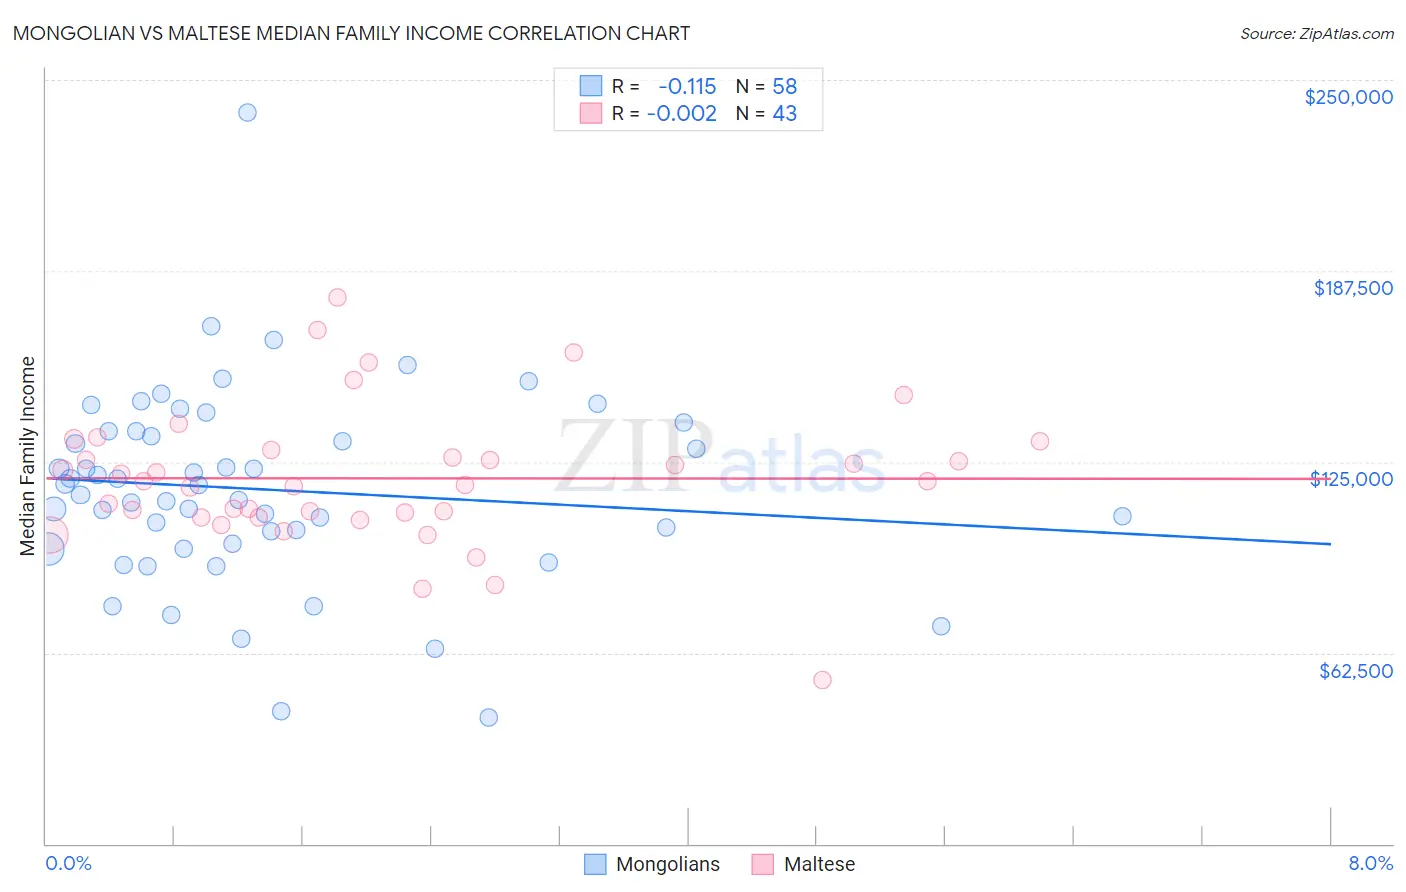
Mongolian vs Maltese Median Family Income Correlation Chart
The statistical analysis conducted on geographies consisting of 140,257,208 people shows a poor negative correlation between the proportion of Mongolians and median family income in the United States with a correlation coefficient (R) of -0.115 and weighted average of $114,553. Similarly, the statistical analysis conducted on geographies consisting of 126,250,272 people shows no correlation between the proportion of Maltese and median family income in the United States with a correlation coefficient (R) of -0.002 and weighted average of $115,862, a difference of 1.1%.
Median Family Income Correlation Summary
| Measurement | Mongolian | Maltese |
| Minimum | $41,389 | $53,672 |
| Maximum | $239,335 | $178,781 |
| Range | $197,946 | $125,109 |
| Mean | $115,974 | $119,621 |
| Median | $115,745 | $118,717 |
| Interquartile 25% (IQ1) | $98,398 | $106,808 |
| Interquartile 75% (IQ3) | $135,066 | $128,909 |
| Interquartile Range (IQR) | $36,668 | $22,102 |
| Standard Deviation (Sample) | $32,155 | $22,839 |
| Standard Deviation (Population) | $31,876 | $22,571 |
Demographics Similar to Mongolians and Maltese by Median Family Income
In terms of median family income, the demographic groups most similar to Mongolians are Immigrants from Belarus ($114,586, a difference of 0.030%), Immigrants from Pakistan ($114,406, a difference of 0.13%), Immigrants from Scotland ($114,392, a difference of 0.14%), Immigrants from Latvia ($114,826, a difference of 0.24%), and Immigrants from Netherlands ($114,987, a difference of 0.38%). Similarly, the demographic groups most similar to Maltese are Immigrants from Malaysia ($115,880, a difference of 0.010%), Immigrants from Norway ($115,847, a difference of 0.010%), Immigrants from Czechoslovakia ($116,165, a difference of 0.26%), Chinese ($116,188, a difference of 0.28%), and Immigrants from Europe ($115,523, a difference of 0.29%).
| Demographics | Rating | Rank | Median Family Income |
| Immigrants | Austria | 99.9 /100 | #47 | Exceptional $116,830 |
| Immigrants | South Africa | 99.9 /100 | #48 | Exceptional $116,286 |
| Chinese | 99.9 /100 | #49 | Exceptional $116,188 |
| Immigrants | Czechoslovakia | 99.9 /100 | #50 | Exceptional $116,165 |
| Immigrants | Malaysia | 99.9 /100 | #51 | Exceptional $115,880 |
| Maltese | 99.9 /100 | #52 | Exceptional $115,862 |
| Immigrants | Norway | 99.9 /100 | #53 | Exceptional $115,847 |
| Immigrants | Europe | 99.9 /100 | #54 | Exceptional $115,523 |
| Lithuanians | 99.8 /100 | #55 | Exceptional $115,395 |
| New Zealanders | 99.8 /100 | #56 | Exceptional $115,230 |
| Greeks | 99.8 /100 | #57 | Exceptional $115,192 |
| Immigrants | Indonesia | 99.8 /100 | #58 | Exceptional $115,162 |
| Immigrants | Netherlands | 99.8 /100 | #59 | Exceptional $114,987 |
| Immigrants | Latvia | 99.8 /100 | #60 | Exceptional $114,826 |
| Immigrants | Belarus | 99.8 /100 | #61 | Exceptional $114,586 |
| Mongolians | 99.8 /100 | #62 | Exceptional $114,553 |
| Immigrants | Pakistan | 99.8 /100 | #63 | Exceptional $114,406 |
| Immigrants | Scotland | 99.7 /100 | #64 | Exceptional $114,392 |
| Egyptians | 99.7 /100 | #65 | Exceptional $114,119 |
| Paraguayans | 99.7 /100 | #66 | Exceptional $114,016 |
| Immigrants | Spain | 99.7 /100 | #67 | Exceptional $113,815 |