Navajo vs Maltese Unemployment Among Ages 45 to 54 years
COMPARE
Navajo
Maltese
Unemployment Among Ages 45 to 54 years
Unemployment Among Ages 45 to 54 years Comparison
Navajo
Maltese
6.7%
UNEMPLOYMENT AMONG AGES 45 TO 54 YEARS
0.0/ 100
METRIC RATING
335th/ 347
METRIC RANK
4.5%
UNEMPLOYMENT AMONG AGES 45 TO 54 YEARS
57.9/ 100
METRIC RATING
165th/ 347
METRIC RANK
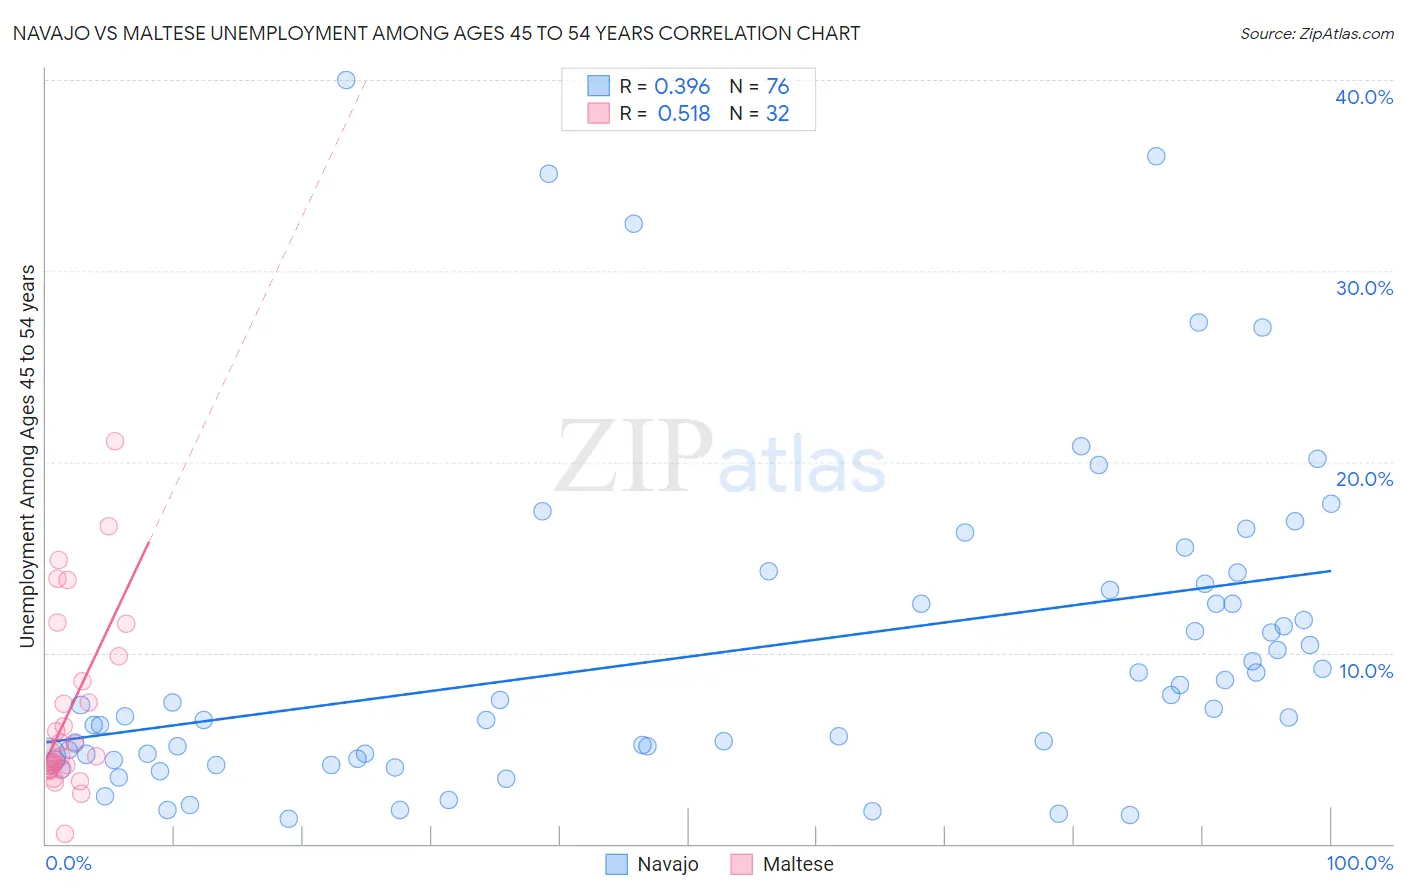
Navajo vs Maltese Unemployment Among Ages 45 to 54 years Correlation Chart
The statistical analysis conducted on geographies consisting of 220,825,201 people shows a mild positive correlation between the proportion of Navajo and unemployment rate among population between the ages 45 and 54 in the United States with a correlation coefficient (R) of 0.396 and weighted average of 6.7%. Similarly, the statistical analysis conducted on geographies consisting of 125,112,482 people shows a substantial positive correlation between the proportion of Maltese and unemployment rate among population between the ages 45 and 54 in the United States with a correlation coefficient (R) of 0.518 and weighted average of 4.5%, a difference of 47.7%.
Unemployment Among Ages 45 to 54 years Correlation Summary
| Measurement | Navajo | Maltese |
| Minimum | 1.3% | 0.50% |
| Maximum | 40.0% | 21.1% |
| Range | 38.7% | 20.6% |
| Mean | 10.1% | 7.0% |
| Median | 7.2% | 4.6% |
| Interquartile 25% (IQ1) | 4.5% | 3.9% |
| Interquartile 75% (IQ3) | 13.0% | 9.1% |
| Interquartile Range (IQR) | 8.4% | 5.2% |
| Standard Deviation (Sample) | 8.5% | 4.8% |
| Standard Deviation (Population) | 8.4% | 4.7% |
Similar Demographics by Unemployment Among Ages 45 to 54 years
Demographics Similar to Navajo by Unemployment Among Ages 45 to 54 years
In terms of unemployment among ages 45 to 54 years, the demographic groups most similar to Navajo are Sioux (6.6%, a difference of 0.48%), Immigrants from Yemen (6.5%, a difference of 1.5%), Puerto Rican (6.8%, a difference of 2.2%), Pima (6.4%, a difference of 3.3%), and Apache (7.0%, a difference of 5.6%).
| Demographics | Rating | Rank | Unemployment Among Ages 45 to 54 years |
| Pueblo | 0.0 /100 | #328 | Tragic 6.2% |
| Alaska Natives | 0.0 /100 | #329 | Tragic 6.3% |
| Immigrants | Dominican Republic | 0.0 /100 | #330 | Tragic 6.3% |
| Tohono O'odham | 0.0 /100 | #331 | Tragic 6.3% |
| Pima | 0.0 /100 | #332 | Tragic 6.4% |
| Immigrants | Yemen | 0.0 /100 | #333 | Tragic 6.5% |
| Sioux | 0.0 /100 | #334 | Tragic 6.6% |
| Navajo | 0.0 /100 | #335 | Tragic 6.7% |
| Puerto Ricans | 0.0 /100 | #336 | Tragic 6.8% |
| Apache | 0.0 /100 | #337 | Tragic 7.0% |
| Colville | 0.0 /100 | #338 | Tragic 7.4% |
| Arapaho | 0.0 /100 | #339 | Tragic 7.5% |
| Hopi | 0.0 /100 | #340 | Tragic 7.5% |
| Paiute | 0.0 /100 | #341 | Tragic 7.8% |
| Alaskan Athabascans | 0.0 /100 | #342 | Tragic 8.5% |
Demographics Similar to Maltese by Unemployment Among Ages 45 to 54 years
In terms of unemployment among ages 45 to 54 years, the demographic groups most similar to Maltese are Immigrants from Western Europe (4.5%, a difference of 0.020%), Samoan (4.5%, a difference of 0.030%), Immigrants from Brazil (4.5%, a difference of 0.070%), Bangladeshi (4.5%, a difference of 0.090%), and Immigrants from Indonesia (4.5%, a difference of 0.12%).
| Demographics | Rating | Rank | Unemployment Among Ages 45 to 54 years |
| Immigrants | Italy | 65.5 /100 | #158 | Good 4.5% |
| Immigrants | Nonimmigrants | 62.8 /100 | #159 | Good 4.5% |
| Immigrants | South Eastern Asia | 62.0 /100 | #160 | Good 4.5% |
| Immigrants | Eastern Europe | 61.6 /100 | #161 | Good 4.5% |
| Immigrants | Indonesia | 60.3 /100 | #162 | Good 4.5% |
| Bangladeshis | 59.7 /100 | #163 | Average 4.5% |
| Samoans | 58.5 /100 | #164 | Average 4.5% |
| Maltese | 57.9 /100 | #165 | Average 4.5% |
| Immigrants | Western Europe | 57.4 /100 | #166 | Average 4.5% |
| Immigrants | Brazil | 56.4 /100 | #167 | Average 4.5% |
| Immigrants | Europe | 54.7 /100 | #168 | Average 4.5% |
| Immigrants | Egypt | 54.7 /100 | #169 | Average 4.5% |
| Spaniards | 54.3 /100 | #170 | Average 4.5% |
| Egyptians | 53.6 /100 | #171 | Average 4.5% |
| Colombians | 53.3 /100 | #172 | Average 4.5% |