Immigrants from the Azores vs Immigrants from Costa Rica Median Household Income
COMPARE
Immigrants from the Azores
Immigrants from Costa Rica
Median Household Income
Median Household Income Comparison
Immigrants from the Azores
Immigrants from Costa Rica
$80,357
MEDIAN HOUSEHOLD INCOME
4.5/ 100
METRIC RATING
233rd/ 347
METRIC RANK
$85,054
MEDIAN HOUSEHOLD INCOME
49.2/ 100
METRIC RATING
175th/ 347
METRIC RANK
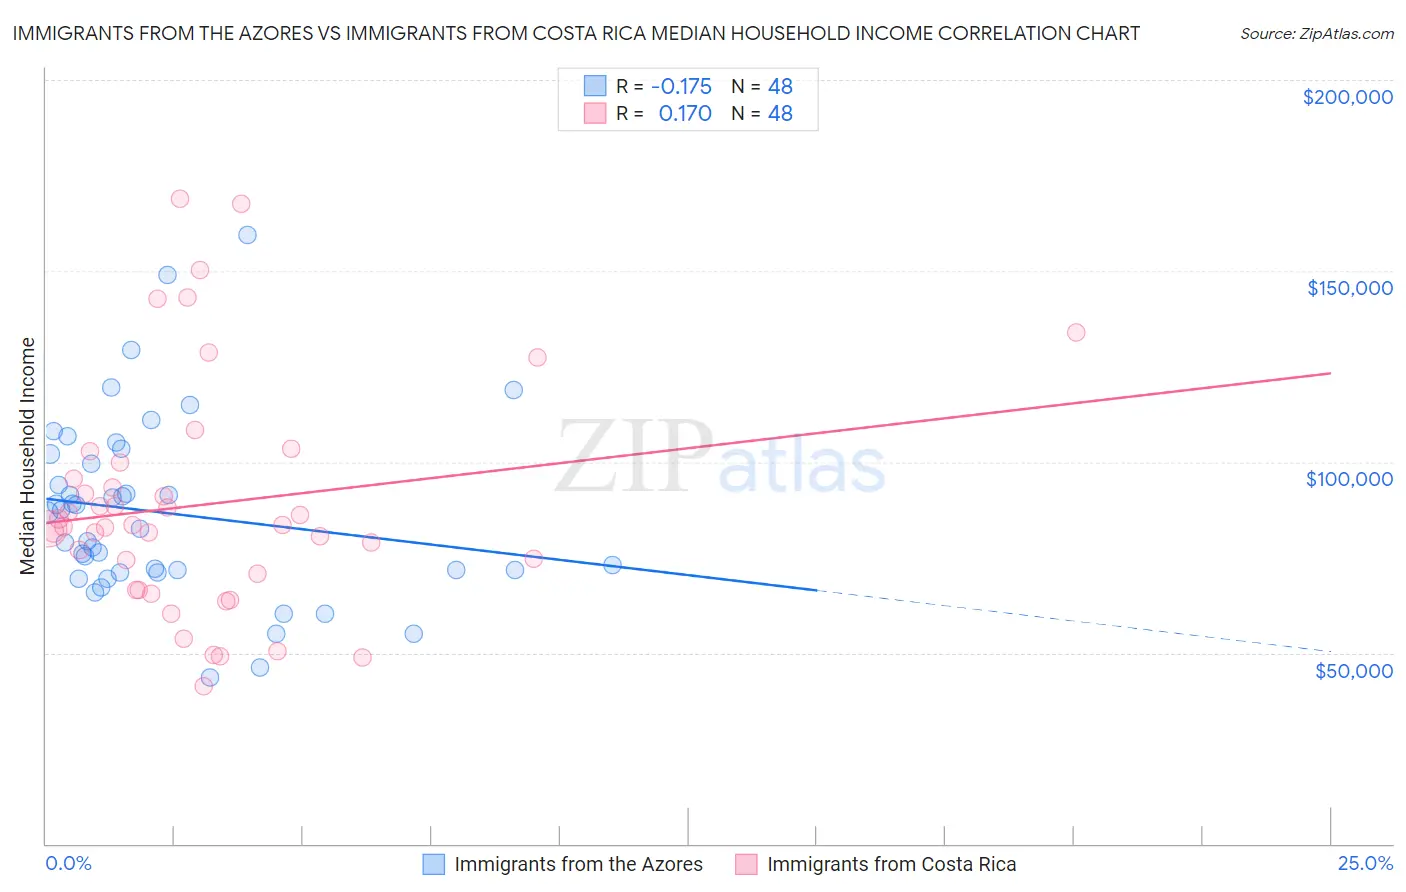
Immigrants from the Azores vs Immigrants from Costa Rica Median Household Income Correlation Chart
The statistical analysis conducted on geographies consisting of 46,252,874 people shows a poor negative correlation between the proportion of Immigrants from the Azores and median household income in the United States with a correlation coefficient (R) of -0.175 and weighted average of $80,357. Similarly, the statistical analysis conducted on geographies consisting of 204,222,655 people shows a poor positive correlation between the proportion of Immigrants from Costa Rica and median household income in the United States with a correlation coefficient (R) of 0.170 and weighted average of $85,054, a difference of 5.8%.
Median Household Income Correlation Summary
| Measurement | Immigrants from the Azores | Immigrants from Costa Rica |
| Minimum | $43,579 | $41,250 |
| Maximum | $159,500 | $168,837 |
| Range | $115,921 | $127,587 |
| Mean | $86,608 | $88,867 |
| Median | $84,537 | $83,191 |
| Interquartile 25% (IQ1) | $71,270 | $68,706 |
| Interquartile 75% (IQ3) | $100,707 | $97,715 |
| Interquartile Range (IQR) | $29,437 | $29,008 |
| Standard Deviation (Sample) | $23,960 | $30,266 |
| Standard Deviation (Population) | $23,710 | $29,949 |
Similar Demographics by Median Household Income
Demographics Similar to Immigrants from the Azores by Median Household Income
In terms of median household income, the demographic groups most similar to Immigrants from the Azores are Immigrants from Trinidad and Tobago ($80,373, a difference of 0.020%), Immigrants from Ecuador ($80,341, a difference of 0.020%), Immigrants from Guyana ($80,324, a difference of 0.040%), Bermudan ($80,406, a difference of 0.060%), and Trinidadian and Tobagonian ($80,402, a difference of 0.060%).
| Demographics | Rating | Rank | Median Household Income |
| Immigrants | Panama | 6.2 /100 | #226 | Tragic $80,873 |
| Guyanese | 5.7 /100 | #227 | Tragic $80,734 |
| Immigrants | Bangladesh | 5.7 /100 | #228 | Tragic $80,722 |
| Delaware | 5.0 /100 | #229 | Tragic $80,527 |
| Bermudans | 4.7 /100 | #230 | Tragic $80,406 |
| Trinidadians and Tobagonians | 4.7 /100 | #231 | Tragic $80,402 |
| Immigrants | Trinidad and Tobago | 4.6 /100 | #232 | Tragic $80,373 |
| Immigrants | Azores | 4.5 /100 | #233 | Tragic $80,357 |
| Immigrants | Ecuador | 4.5 /100 | #234 | Tragic $80,341 |
| Immigrants | Guyana | 4.5 /100 | #235 | Tragic $80,324 |
| Immigrants | Bosnia and Herzegovina | 3.4 /100 | #236 | Tragic $79,888 |
| Nicaraguans | 3.1 /100 | #237 | Tragic $79,737 |
| Barbadians | 3.0 /100 | #238 | Tragic $79,664 |
| Alaska Natives | 2.7 /100 | #239 | Tragic $79,509 |
| Immigrants | Western Africa | 2.7 /100 | #240 | Tragic $79,490 |
Demographics Similar to Immigrants from Costa Rica by Median Household Income
In terms of median household income, the demographic groups most similar to Immigrants from Costa Rica are Alsatian ($85,053, a difference of 0.0%), Immigrants from Eritrea ($85,025, a difference of 0.030%), Scottish ($85,101, a difference of 0.050%), Czechoslovakian ($84,965, a difference of 0.10%), and English ($84,915, a difference of 0.16%).
| Demographics | Rating | Rank | Median Household Income |
| Icelanders | 61.0 /100 | #168 | Good $85,797 |
| Colombians | 59.7 /100 | #169 | Average $85,716 |
| Swiss | 59.2 /100 | #170 | Average $85,681 |
| Immigrants | South America | 58.1 /100 | #171 | Average $85,611 |
| Slovenes | 57.4 /100 | #172 | Average $85,562 |
| Immigrants | Cameroon | 53.4 /100 | #173 | Average $85,314 |
| Scottish | 50.0 /100 | #174 | Average $85,101 |
| Immigrants | Costa Rica | 49.2 /100 | #175 | Average $85,054 |
| Alsatians | 49.2 /100 | #176 | Average $85,053 |
| Immigrants | Eritrea | 48.8 /100 | #177 | Average $85,025 |
| Czechoslovakians | 47.8 /100 | #178 | Average $84,965 |
| English | 47.0 /100 | #179 | Average $84,915 |
| Immigrants | Portugal | 44.2 /100 | #180 | Average $84,740 |
| Hawaiians | 44.1 /100 | #181 | Average $84,729 |
| Uruguayans | 43.5 /100 | #182 | Average $84,691 |