Alsatian vs Immigrants from Costa Rica Median Household Income
COMPARE
Alsatian
Immigrants from Costa Rica
Median Household Income
Median Household Income Comparison
Alsatians
Immigrants from Costa Rica
$85,053
MEDIAN HOUSEHOLD INCOME
49.2/ 100
METRIC RATING
176th/ 347
METRIC RANK
$85,054
MEDIAN HOUSEHOLD INCOME
49.2/ 100
METRIC RATING
175th/ 347
METRIC RANK
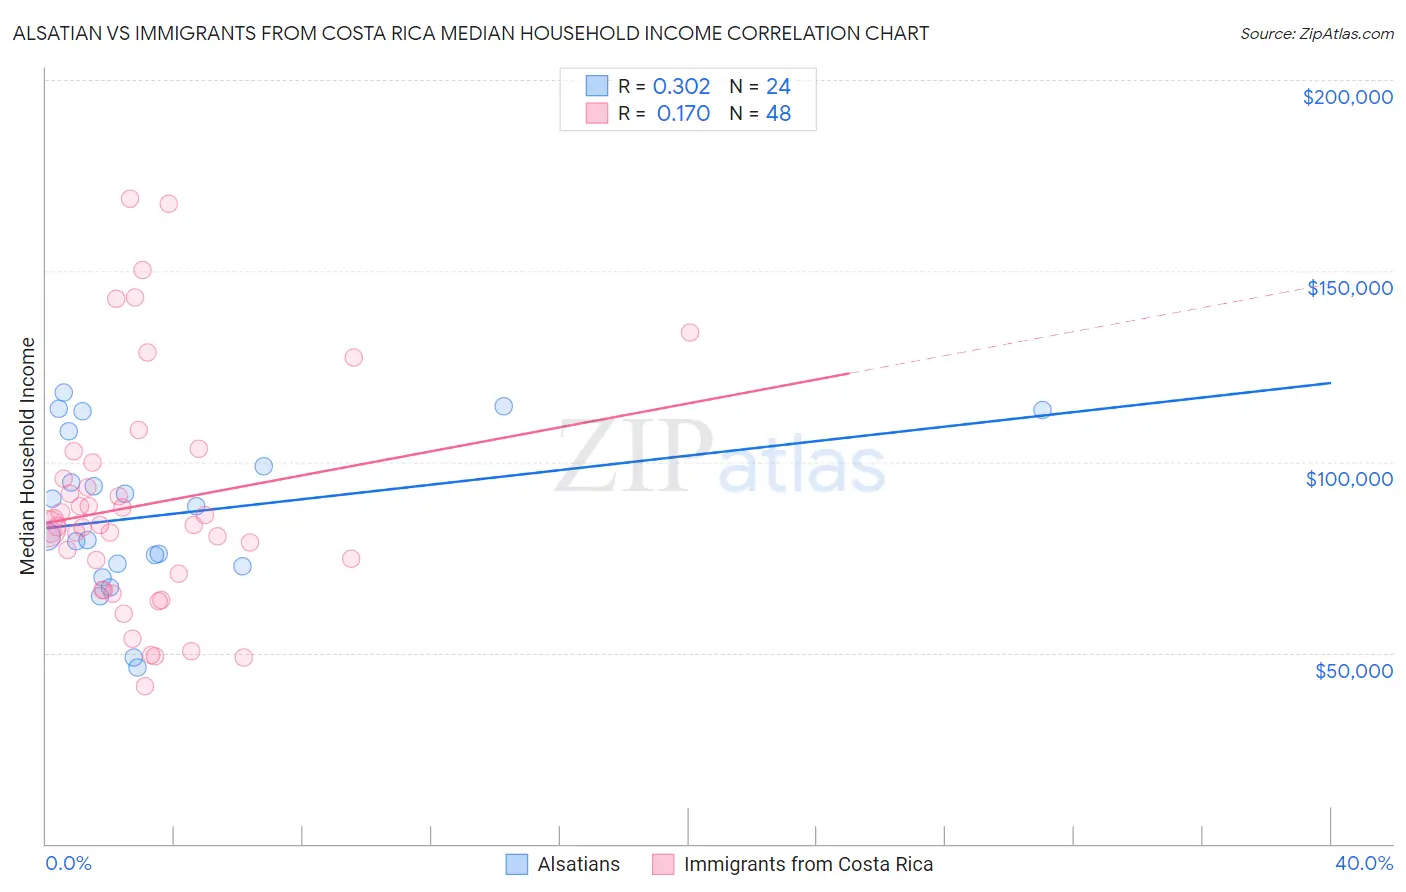
Alsatian vs Immigrants from Costa Rica Median Household Income Correlation Chart
The statistical analysis conducted on geographies consisting of 82,678,631 people shows a mild positive correlation between the proportion of Alsatians and median household income in the United States with a correlation coefficient (R) of 0.302 and weighted average of $85,053. Similarly, the statistical analysis conducted on geographies consisting of 204,222,655 people shows a poor positive correlation between the proportion of Immigrants from Costa Rica and median household income in the United States with a correlation coefficient (R) of 0.170 and weighted average of $85,054, a difference of 0.0%.
Median Household Income Correlation Summary
| Measurement | Alsatian | Immigrants from Costa Rica |
| Minimum | $46,250 | $41,250 |
| Maximum | $118,135 | $168,837 |
| Range | $71,885 | $127,587 |
| Mean | $86,339 | $88,867 |
| Median | $84,486 | $83,191 |
| Interquartile 25% (IQ1) | $73,000 | $68,706 |
| Interquartile 75% (IQ3) | $103,435 | $97,715 |
| Interquartile Range (IQR) | $30,436 | $29,008 |
| Standard Deviation (Sample) | $20,538 | $30,266 |
| Standard Deviation (Population) | $20,105 | $29,949 |
Demographics Similar to Alsatians and Immigrants from Costa Rica by Median Household Income
In terms of median household income, the demographic groups most similar to Alsatians are Immigrants from Eritrea ($85,025, a difference of 0.030%), Scottish ($85,101, a difference of 0.060%), Czechoslovakian ($84,965, a difference of 0.10%), English ($84,915, a difference of 0.16%), and Immigrants from Cameroon ($85,314, a difference of 0.31%). Similarly, the demographic groups most similar to Immigrants from Costa Rica are Immigrants from Eritrea ($85,025, a difference of 0.030%), Scottish ($85,101, a difference of 0.050%), Czechoslovakian ($84,965, a difference of 0.10%), English ($84,915, a difference of 0.16%), and Immigrants from Cameroon ($85,314, a difference of 0.31%).
| Demographics | Rating | Rank | Median Household Income |
| Norwegians | 65.3 /100 | #165 | Good $86,084 |
| Scandinavians | 65.1 /100 | #166 | Good $86,073 |
| Immigrants | Immigrants | 61.3 /100 | #167 | Good $85,818 |
| Icelanders | 61.0 /100 | #168 | Good $85,797 |
| Colombians | 59.7 /100 | #169 | Average $85,716 |
| Swiss | 59.2 /100 | #170 | Average $85,681 |
| Immigrants | South America | 58.1 /100 | #171 | Average $85,611 |
| Slovenes | 57.4 /100 | #172 | Average $85,562 |
| Immigrants | Cameroon | 53.4 /100 | #173 | Average $85,314 |
| Scottish | 50.0 /100 | #174 | Average $85,101 |
| Immigrants | Costa Rica | 49.2 /100 | #175 | Average $85,054 |
| Alsatians | 49.2 /100 | #176 | Average $85,053 |
| Immigrants | Eritrea | 48.8 /100 | #177 | Average $85,025 |
| Czechoslovakians | 47.8 /100 | #178 | Average $84,965 |
| English | 47.0 /100 | #179 | Average $84,915 |
| Immigrants | Portugal | 44.2 /100 | #180 | Average $84,740 |
| Hawaiians | 44.1 /100 | #181 | Average $84,729 |
| Uruguayans | 43.5 /100 | #182 | Average $84,691 |
| Spaniards | 42.7 /100 | #183 | Average $84,644 |
| Immigrants | Eastern Africa | 37.4 /100 | #184 | Fair $84,299 |
| Kenyans | 34.2 /100 | #185 | Fair $84,085 |