Navajo vs German Russian Seniors Poverty Over the Age of 65
COMPARE
Navajo
German Russian
Seniors Poverty Over the Age of 65
Seniors Poverty Over the Age of 65 Comparison
Navajo
German Russians
17.5%
SENIORS POVERTY OVER THE AGE OF 65
0.0/ 100
METRIC RATING
339th/ 347
METRIC RANK
11.0%
SENIORS POVERTY OVER THE AGE OF 65
46.9/ 100
METRIC RATING
178th/ 347
METRIC RANK
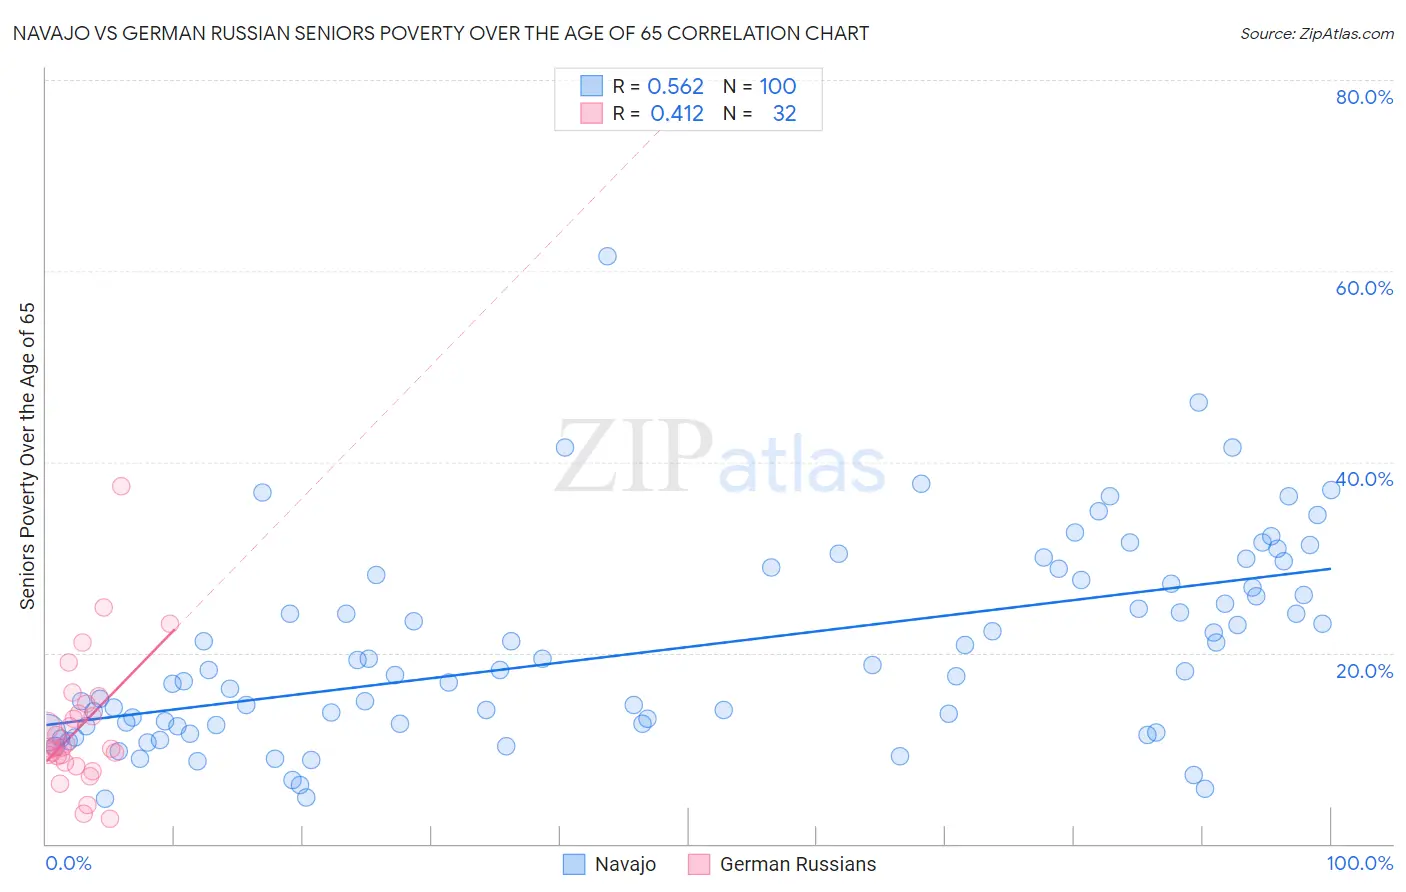
Navajo vs German Russian Seniors Poverty Over the Age of 65 Correlation Chart
The statistical analysis conducted on geographies consisting of 223,980,676 people shows a substantial positive correlation between the proportion of Navajo and poverty level among seniors over the age of 65 in the United States with a correlation coefficient (R) of 0.562 and weighted average of 17.5%. Similarly, the statistical analysis conducted on geographies consisting of 96,327,795 people shows a moderate positive correlation between the proportion of German Russians and poverty level among seniors over the age of 65 in the United States with a correlation coefficient (R) of 0.412 and weighted average of 11.0%, a difference of 59.2%.
Seniors Poverty Over the Age of 65 Correlation Summary
| Measurement | Navajo | German Russian |
| Minimum | 4.8% | 2.6% |
| Maximum | 61.5% | 37.5% |
| Range | 56.8% | 34.9% |
| Mean | 20.3% | 12.3% |
| Median | 18.1% | 10.1% |
| Interquartile 25% (IQ1) | 12.3% | 8.9% |
| Interquartile 75% (IQ3) | 27.5% | 14.1% |
| Interquartile Range (IQR) | 15.1% | 5.2% |
| Standard Deviation (Sample) | 10.4% | 6.9% |
| Standard Deviation (Population) | 10.4% | 6.8% |
Similar Demographics by Seniors Poverty Over the Age of 65
Demographics Similar to Navajo by Seniors Poverty Over the Age of 65
In terms of seniors poverty over the age of 65, the demographic groups most similar to Navajo are Pueblo (17.2%, a difference of 1.5%), Hopi (17.8%, a difference of 1.9%), Dominican (17.8%, a difference of 2.3%), Immigrants from Cuba (17.9%, a difference of 2.8%), and Lumbee (18.1%, a difference of 3.9%).
| Demographics | Rating | Rank | Seniors Poverty Over the Age of 65 |
| Immigrants | Grenada | 0.0 /100 | #332 | Tragic 15.8% |
| Immigrants | Yemen | 0.0 /100 | #333 | Tragic 15.9% |
| Immigrants | Nicaragua | 0.0 /100 | #334 | Tragic 15.9% |
| Cubans | 0.0 /100 | #335 | Tragic 16.1% |
| Immigrants | Cabo Verde | 0.0 /100 | #336 | Tragic 16.2% |
| Immigrants | Caribbean | 0.0 /100 | #337 | Tragic 16.5% |
| Pueblo | 0.0 /100 | #338 | Tragic 17.2% |
| Navajo | 0.0 /100 | #339 | Tragic 17.5% |
| Hopi | 0.0 /100 | #340 | Tragic 17.8% |
| Dominicans | 0.0 /100 | #341 | Tragic 17.8% |
| Immigrants | Cuba | 0.0 /100 | #342 | Tragic 17.9% |
| Lumbee | 0.0 /100 | #343 | Tragic 18.1% |
| Immigrants | Dominican Republic | 0.0 /100 | #344 | Tragic 18.3% |
| Pima | 0.0 /100 | #345 | Tragic 19.8% |
| Tohono O'odham | 0.0 /100 | #346 | Tragic 20.8% |
Demographics Similar to German Russians by Seniors Poverty Over the Age of 65
In terms of seniors poverty over the age of 65, the demographic groups most similar to German Russians are Cherokee (11.0%, a difference of 0.040%), Immigrants from Malaysia (11.0%, a difference of 0.090%), Immigrants from Northern Africa (11.0%, a difference of 0.21%), Creek (10.9%, a difference of 0.24%), and Immigrants from Sudan (10.9%, a difference of 0.28%).
| Demographics | Rating | Rank | Seniors Poverty Over the Age of 65 |
| Immigrants | Nonimmigrants | 55.1 /100 | #171 | Average 10.9% |
| Immigrants | Syria | 54.7 /100 | #172 | Average 10.9% |
| Spaniards | 50.7 /100 | #173 | Average 10.9% |
| Immigrants | Sudan | 50.0 /100 | #174 | Average 10.9% |
| Creek | 49.6 /100 | #175 | Average 10.9% |
| Immigrants | Malaysia | 47.9 /100 | #176 | Average 11.0% |
| Cherokee | 47.3 /100 | #177 | Average 11.0% |
| German Russians | 46.9 /100 | #178 | Average 11.0% |
| Immigrants | Northern Africa | 44.6 /100 | #179 | Average 11.0% |
| Immigrants | Thailand | 43.5 /100 | #180 | Average 11.0% |
| Immigrants | Eastern Africa | 43.4 /100 | #181 | Average 11.0% |
| Immigrants | Fiji | 42.0 /100 | #182 | Average 11.0% |
| Immigrants | Kazakhstan | 41.0 /100 | #183 | Average 11.0% |
| Immigrants | France | 40.9 /100 | #184 | Average 11.0% |
| Immigrants | Lebanon | 38.2 /100 | #185 | Fair 11.1% |